Use the Pivot Chart in the Portfolio Area
This article explains how to use the Pivot Chart in the My Portfolio Area.
Access the Pivot Chart
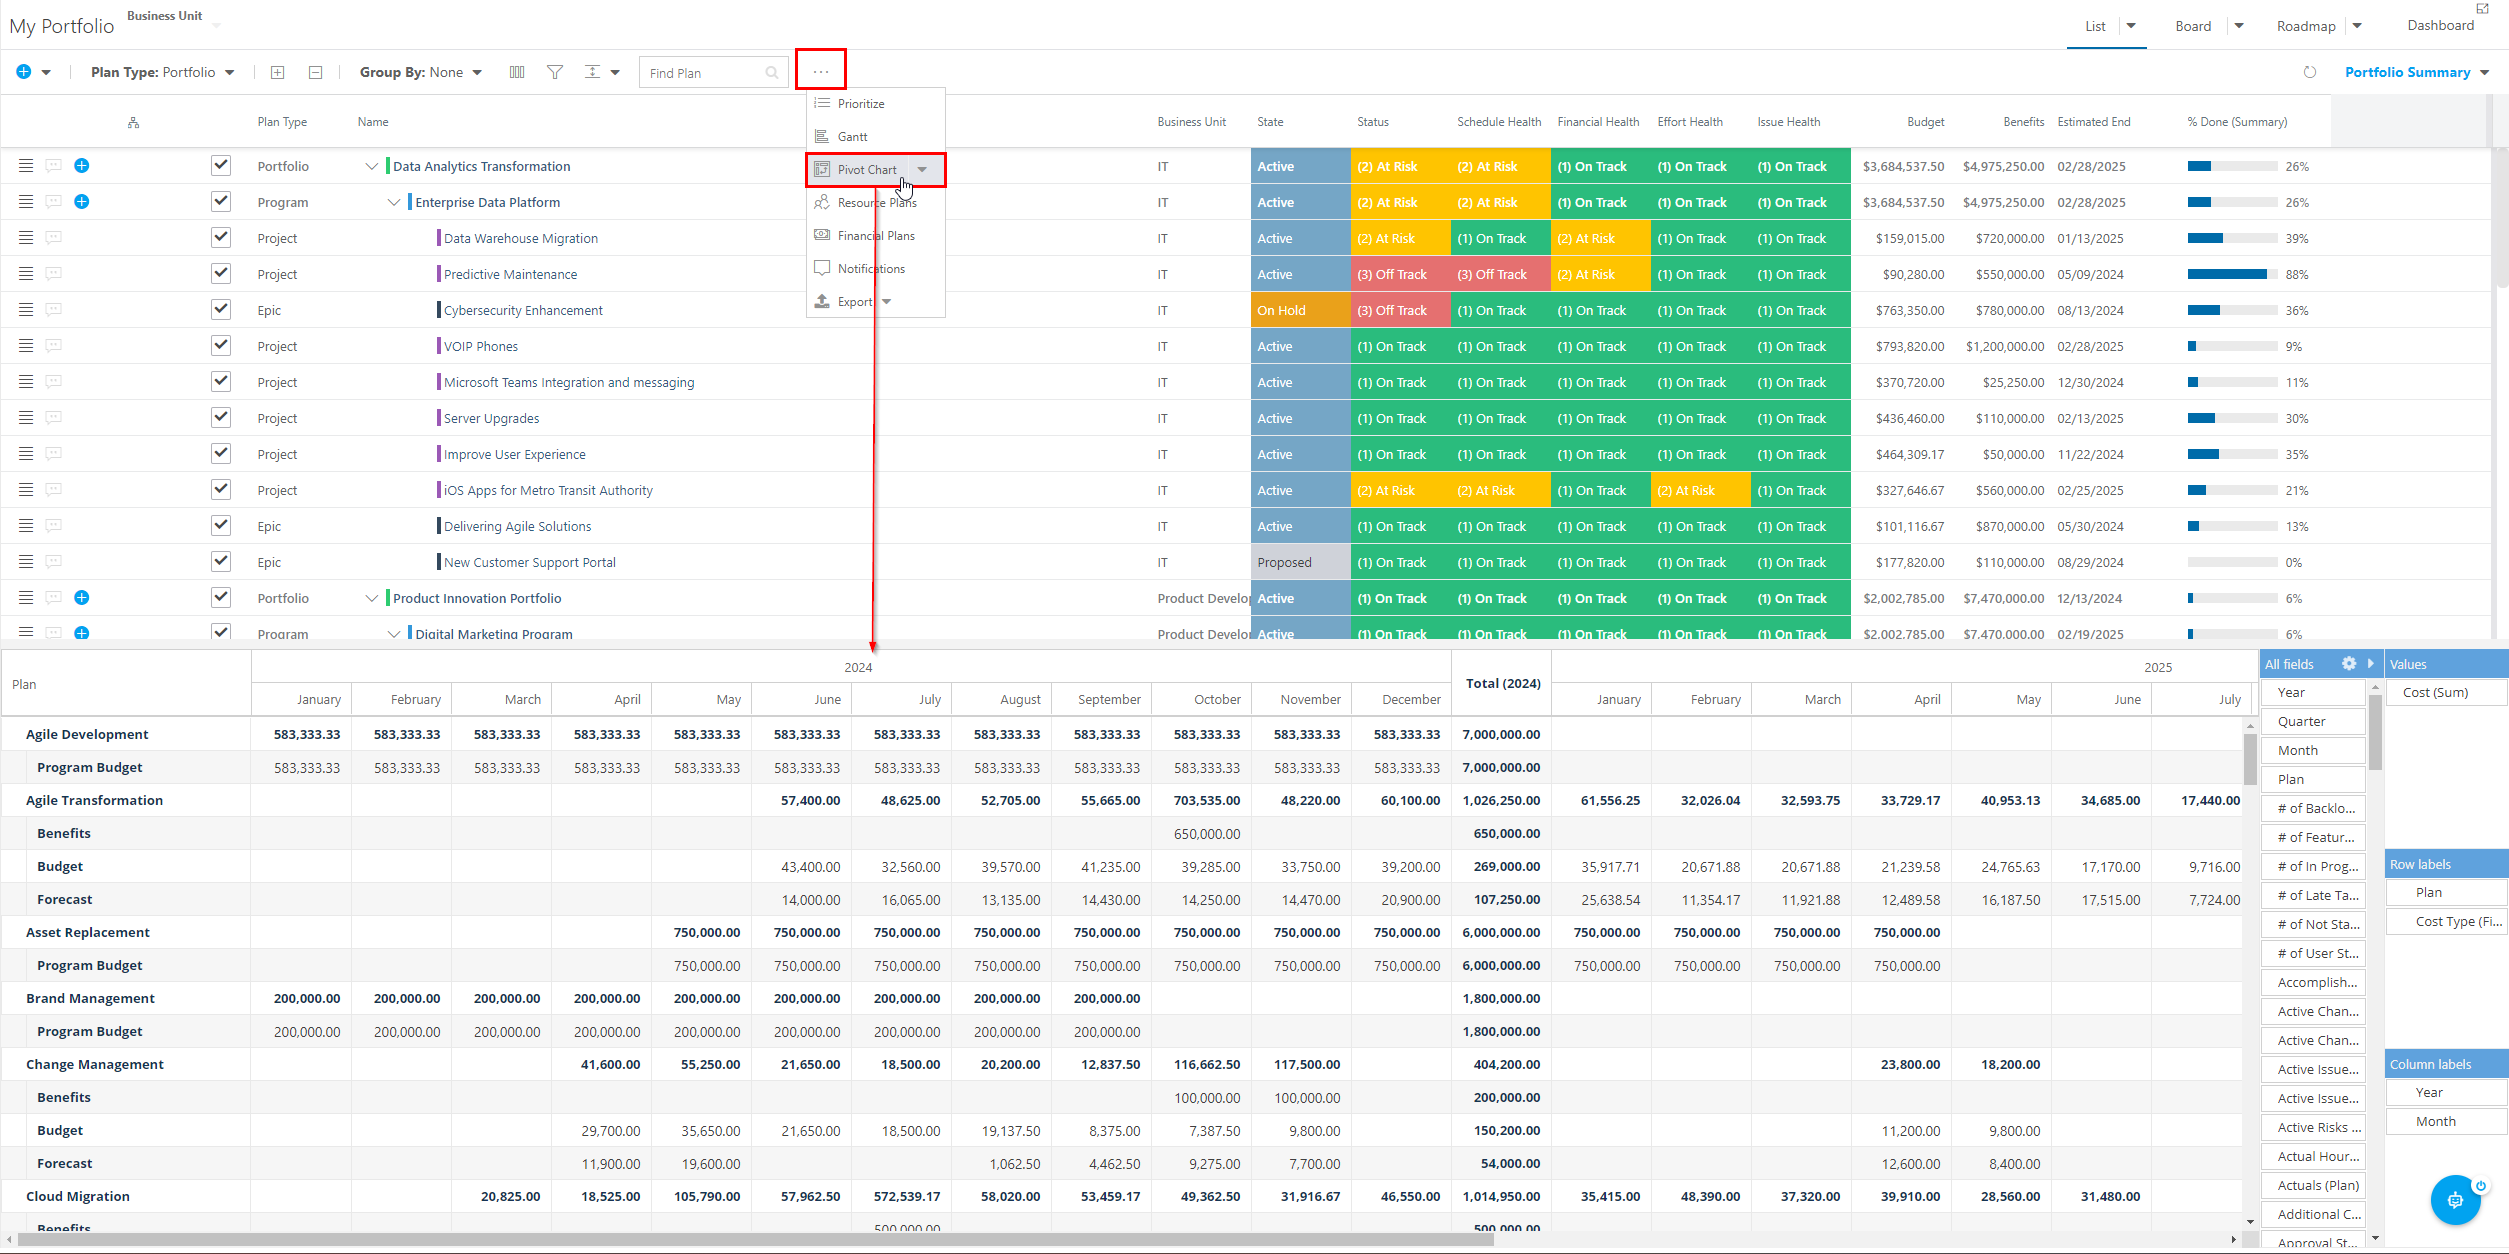
To access the Pivot Chart, click on the Widgets button in the Portfolio header, then select Pivot Chart. The Pivot Chart will open in the bottom half of your window.
Select the Pivot Chart Row Labels, Column Labels, and Values
There are a couple of ways that you can add and remove fields and values from the Portfolio Pivot Chart. The Pivot Chart interface gives you the ability to customize the chart so you can analyze the Portfolio data that is most important to you.
Drag and Drop Fields
The first method for adding or removing fields or values from the Pivot Chart is to simply drag and drop the fields.
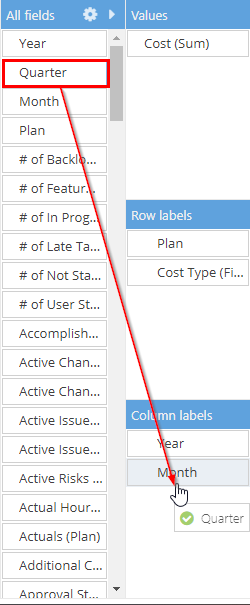
To add a field to the Pivot Chart, select the field from the All Fields section, then drag to the desired location - either Values, Row Labels, or Column Labels - and drop the field. The Pivot Table will automatically update with the added field.
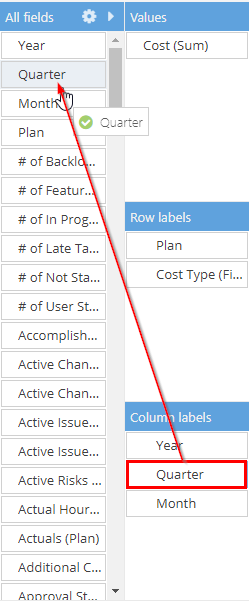
To remove a field from the Pivot Chart, select the field from either the Values, Row Labels, or Column Labels section, then drag and drop it into the All Fields section. The Pivot Chart will automatically update with the field removed.
Use the Field Menu
The second method to add or remove fields or values from the Pivot Chart is to use the Fields Menu.
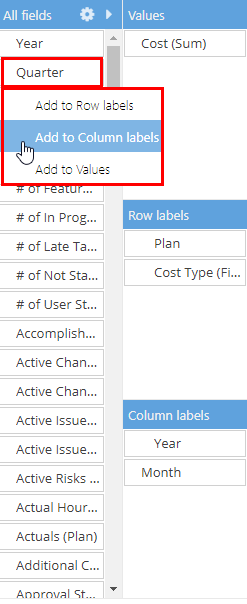
To add a field, click on the desired field from the All Fields section, then select where you would like to add the field from the menu. The Pivot Table will automatically update with the added field.
To remove a field, click on the desired field from the Values, Row Labels, or Column Labels sections, then select Remove Field. The Pivot Chart will automatically update with the field removed.
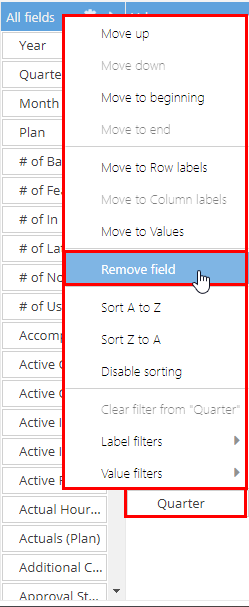
Using the Field Menu, you can also rearrange the field order, relocate the field to a different area of the Pivot Chart, sort the field values, and apply filters to the field values.
Configure the Pivot Chart Settings
You can use the Pivot Chart settings to configure the appearance and layout of your Pivot Chart.
Click on the settings gear in the All Fields header. The Settings form will open.
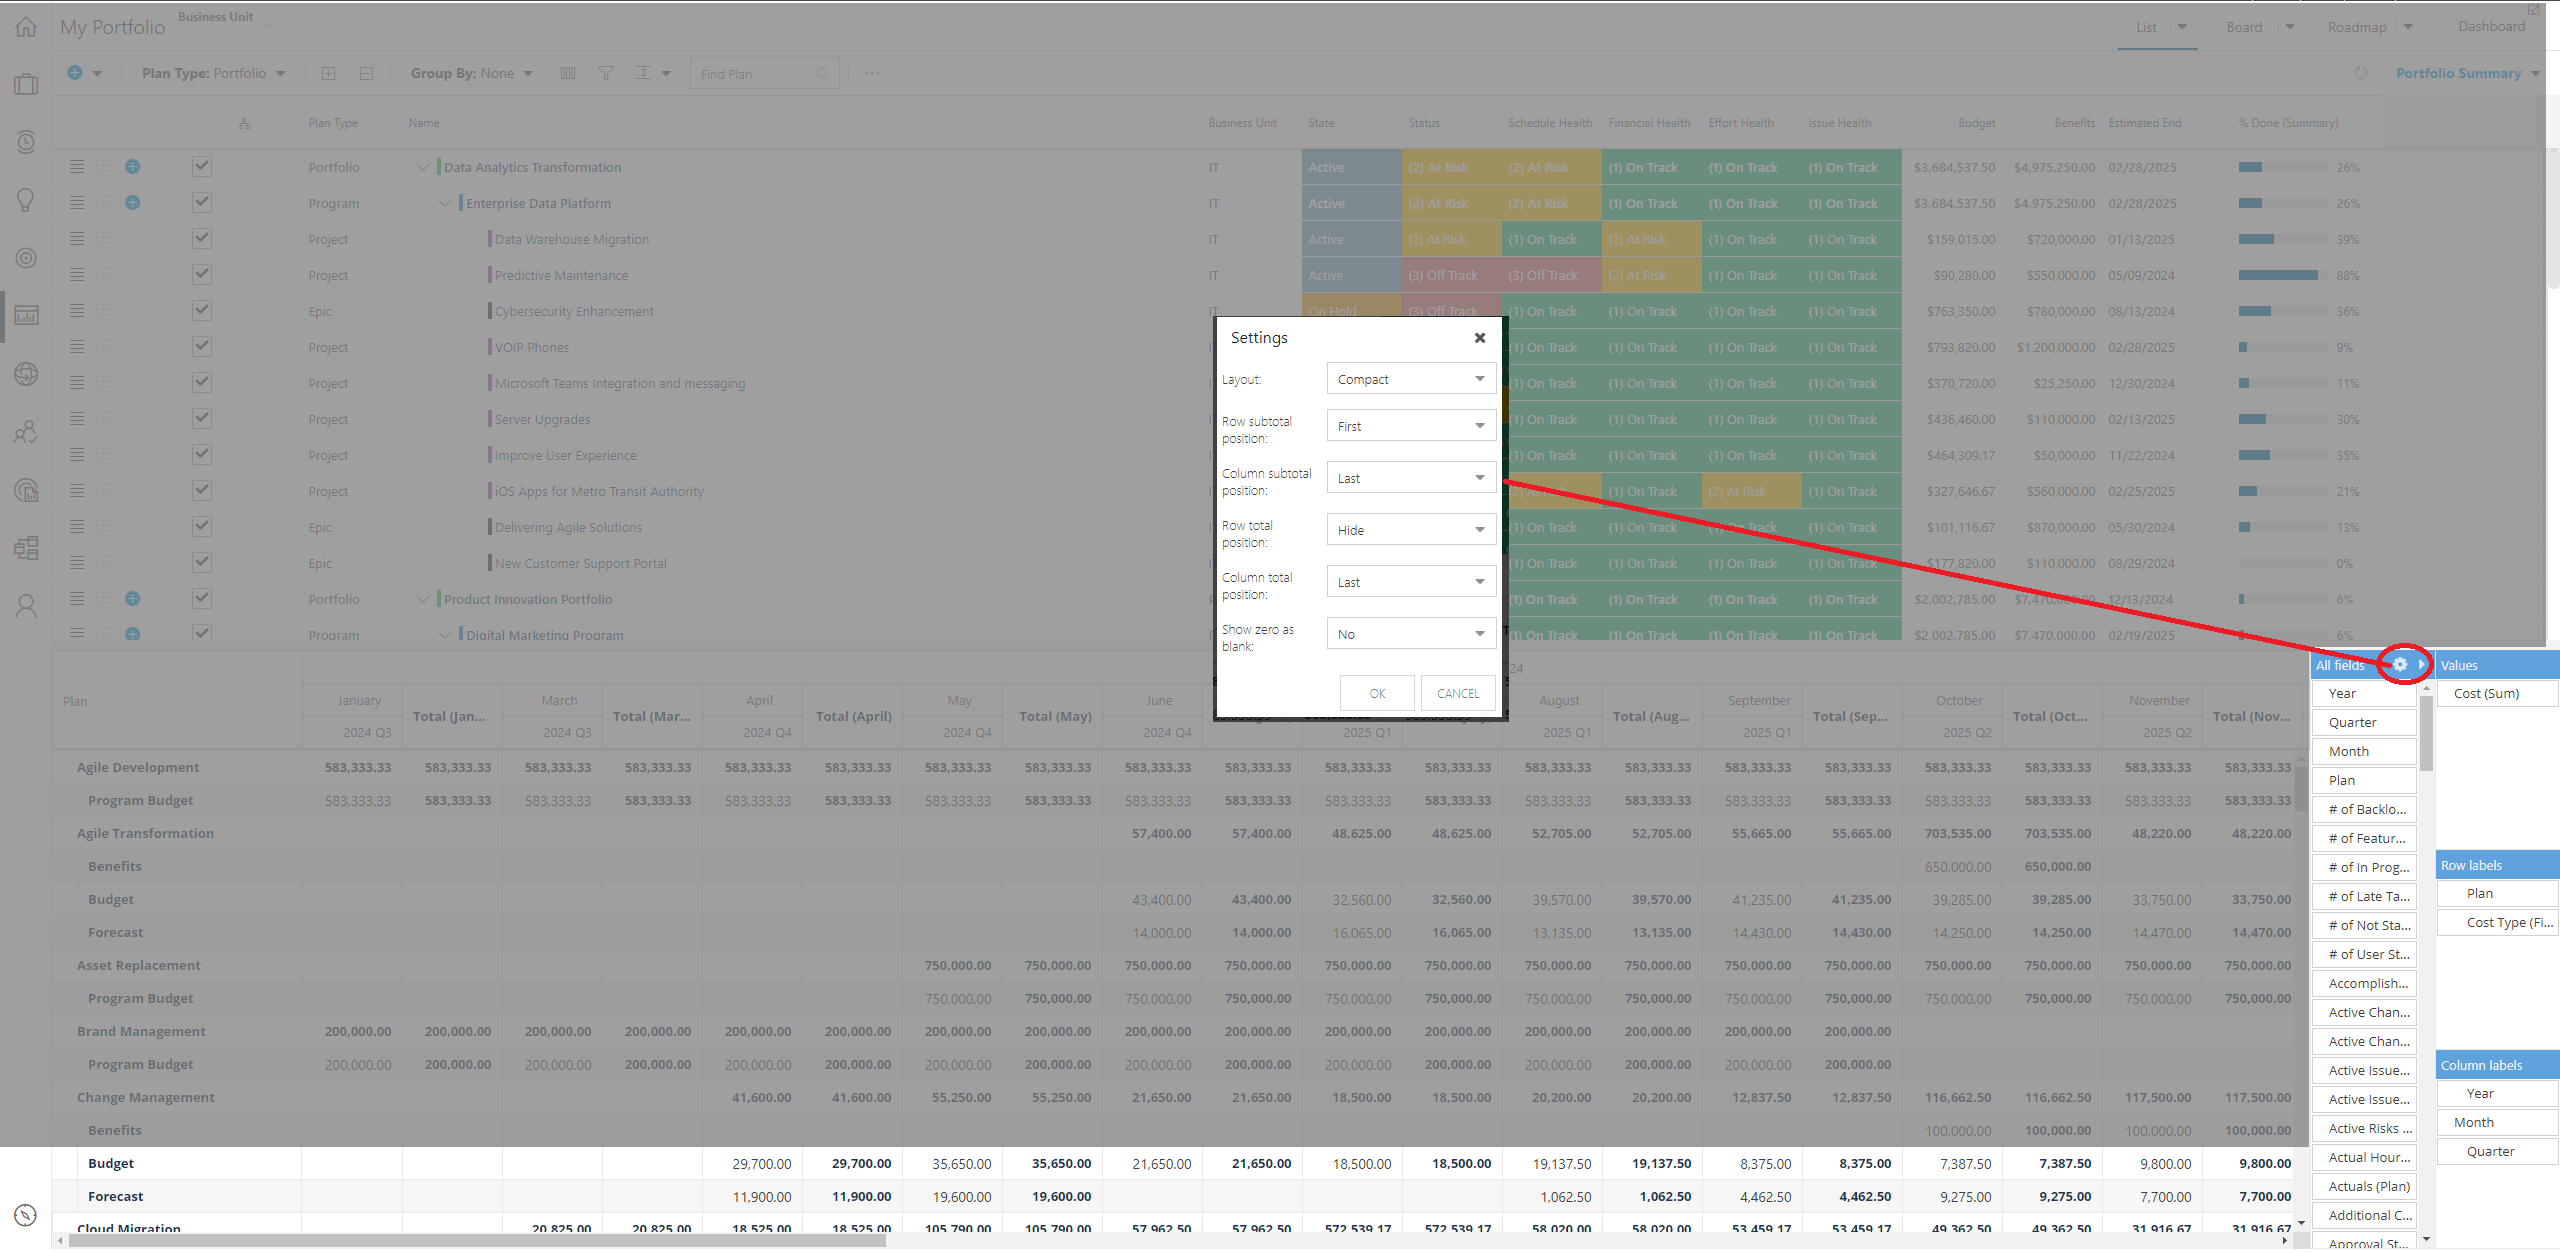
Select a Layout. Options include:
Outline

Compact (default)

Tabular

Select the Row subtotal position. Options include:
First

Hide

Last

Select the Column subtotal position. Options include:
First

Hide

Last

Select the Row total position. Options include:
First

Hide

Last

Select the Column total position. Options include:
First

Hide

Last

Select whether to Show zero as blank or not. Options include:
Yes
No
Click OK to apply your changes to the Pivot Chart.
Export the Pivot Chart
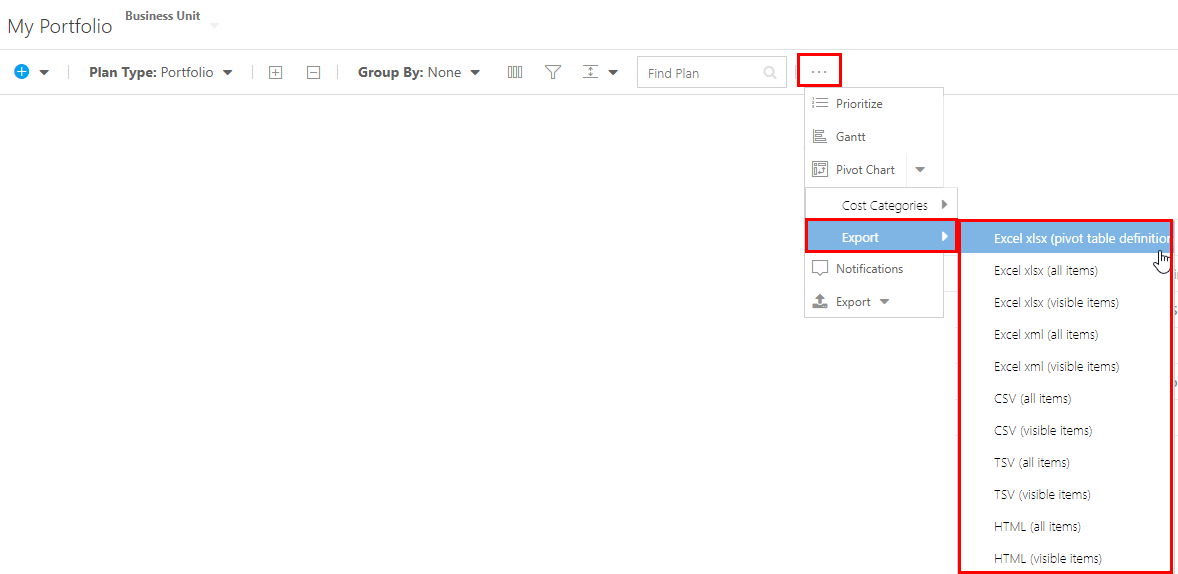
OnePlan allows you to export the Portfolio Pivot Chart to many different formats, including:
Excel xlsx (pivot table definition)
Excel xlsx (all items)
Excel xlsx (visible items)
Excel xml (all items)
Excel xml (visible items)
CSV (all items)
CSV (visible items)
TSV (all items)
TSV (visible items)
HTML (all items)
HTML (visible items)
To export your Pivot Chart:
Click on the Widgets icon in the Portfolio header, then select Pivot Chart > Export, and select the format you would like to export to.
The file will be saved to your Downloads folder.
