Portfolio Board
This article explains the features and functionality of the OnePlan Portfolio Board.
OnePlan Portfolio Board is a visual tool used to track and manage the progress of plans within a portfolio. It includes a series of columns and/or lanes that represent the different stages or phases of the plan lifecycle, and it can be used to display information about each plan, such as the plan name, owner, status, budget and more.
Portfolio Board Configuration Example
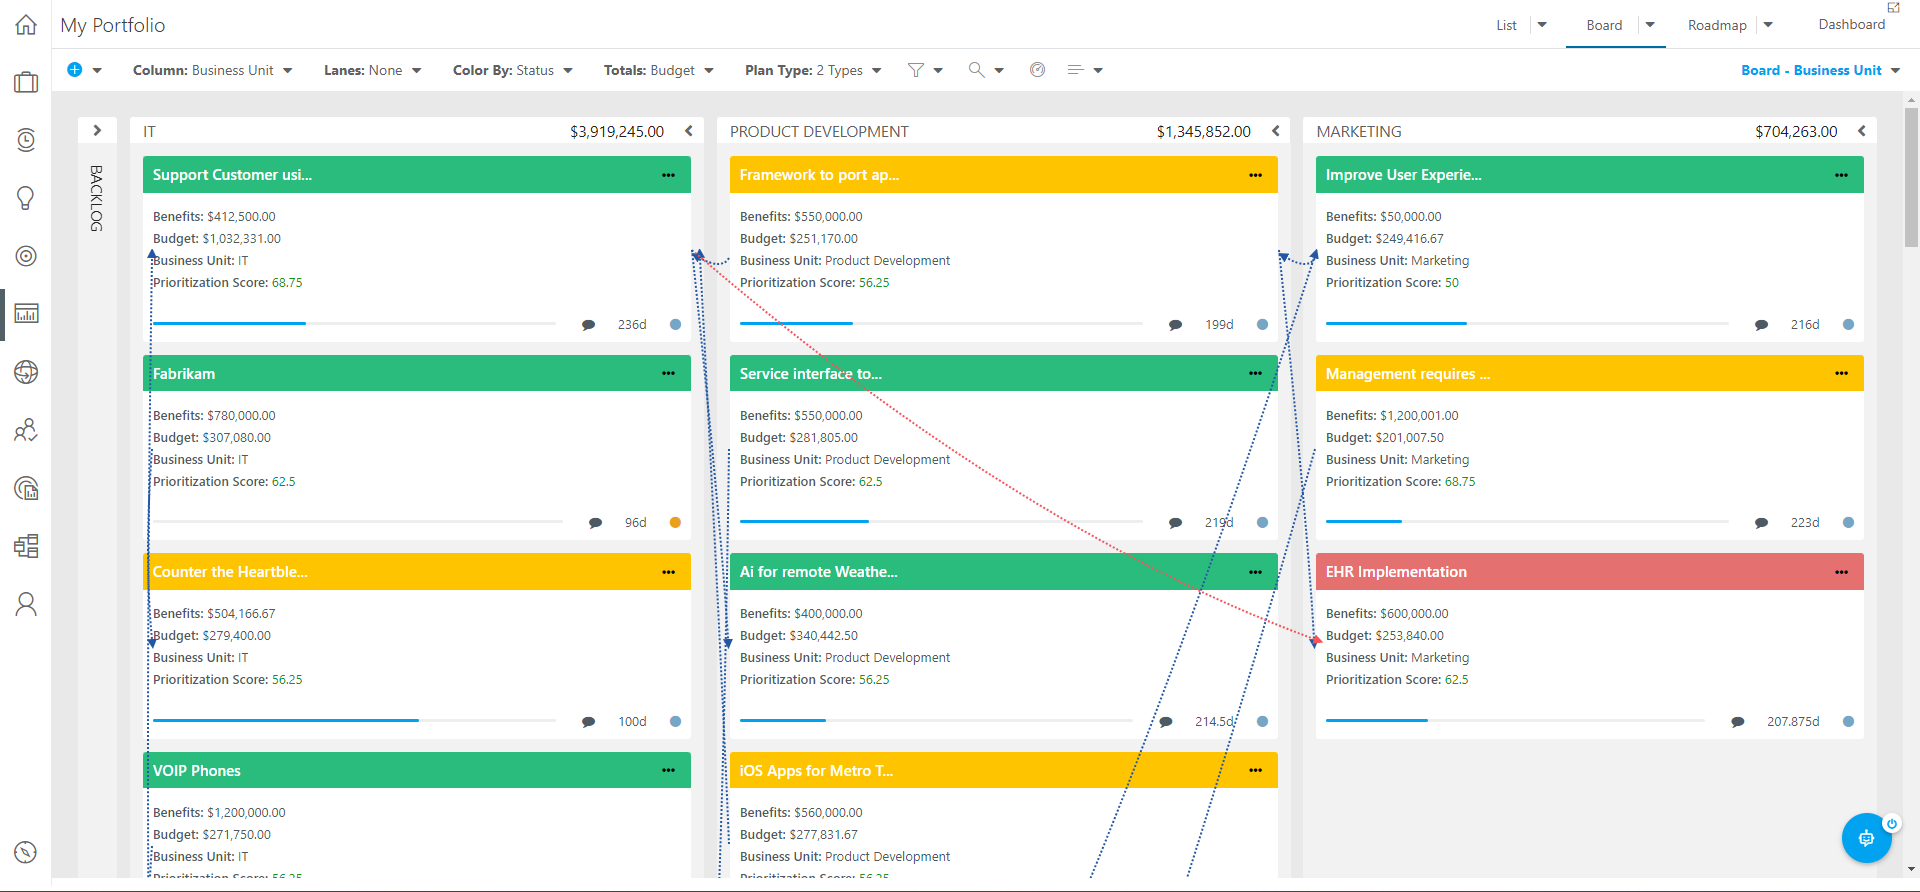
Let's begin by taking a look at an example Portfolio Board. The board view is customizable, so it can be helpful to see an example of how the board can be configured.
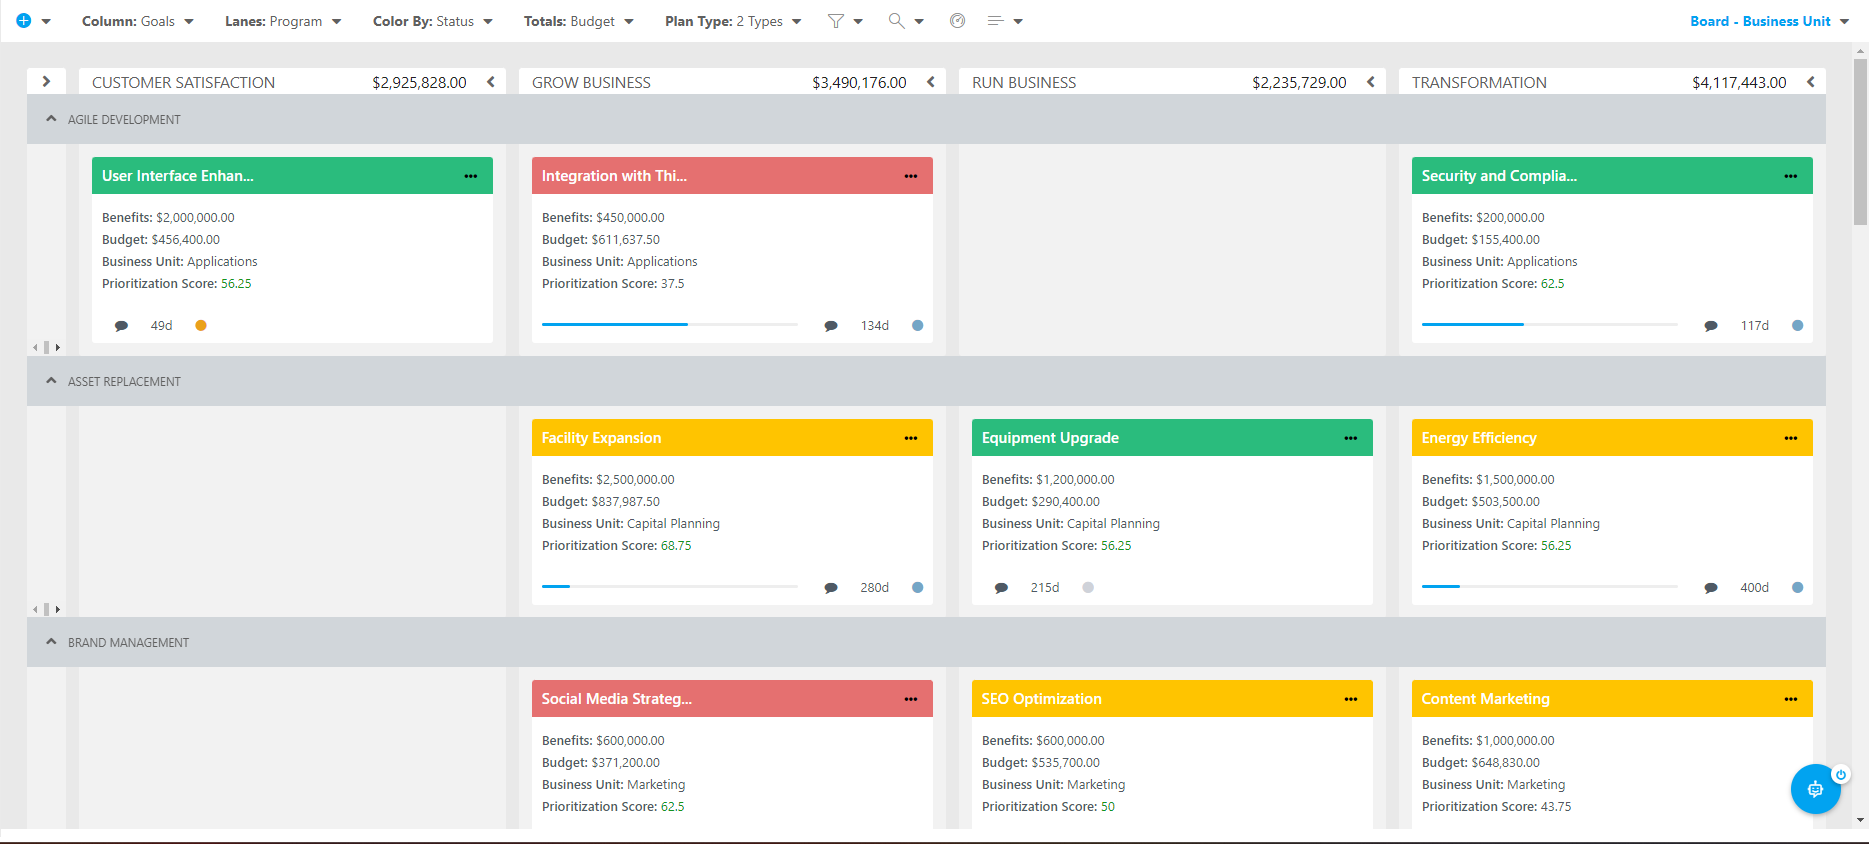
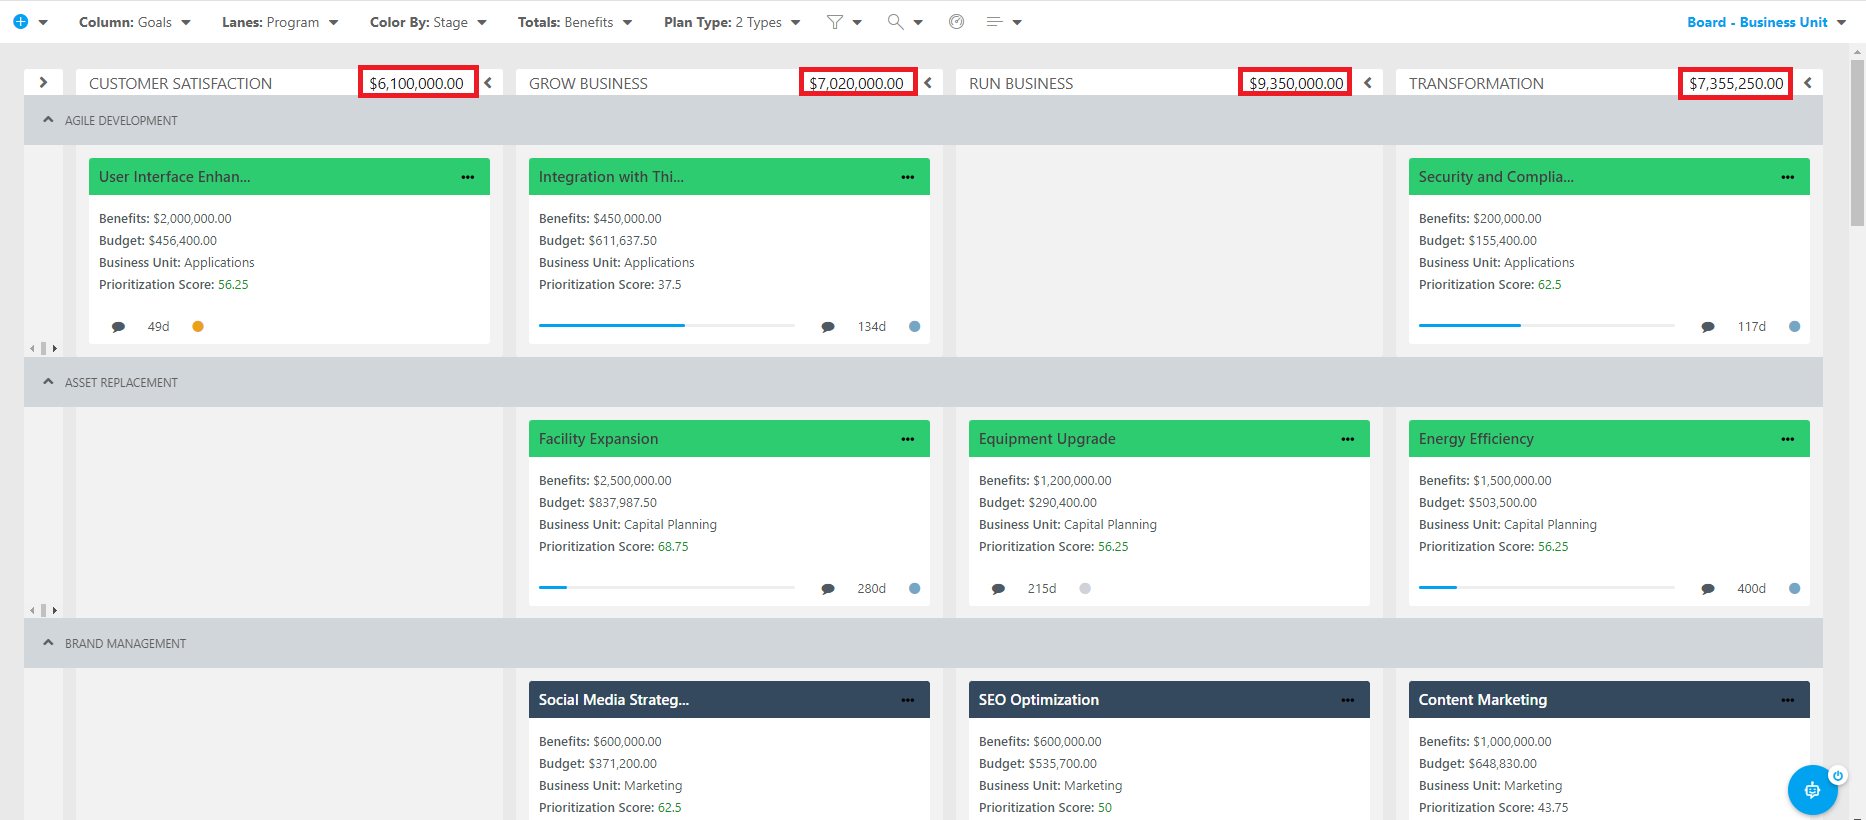
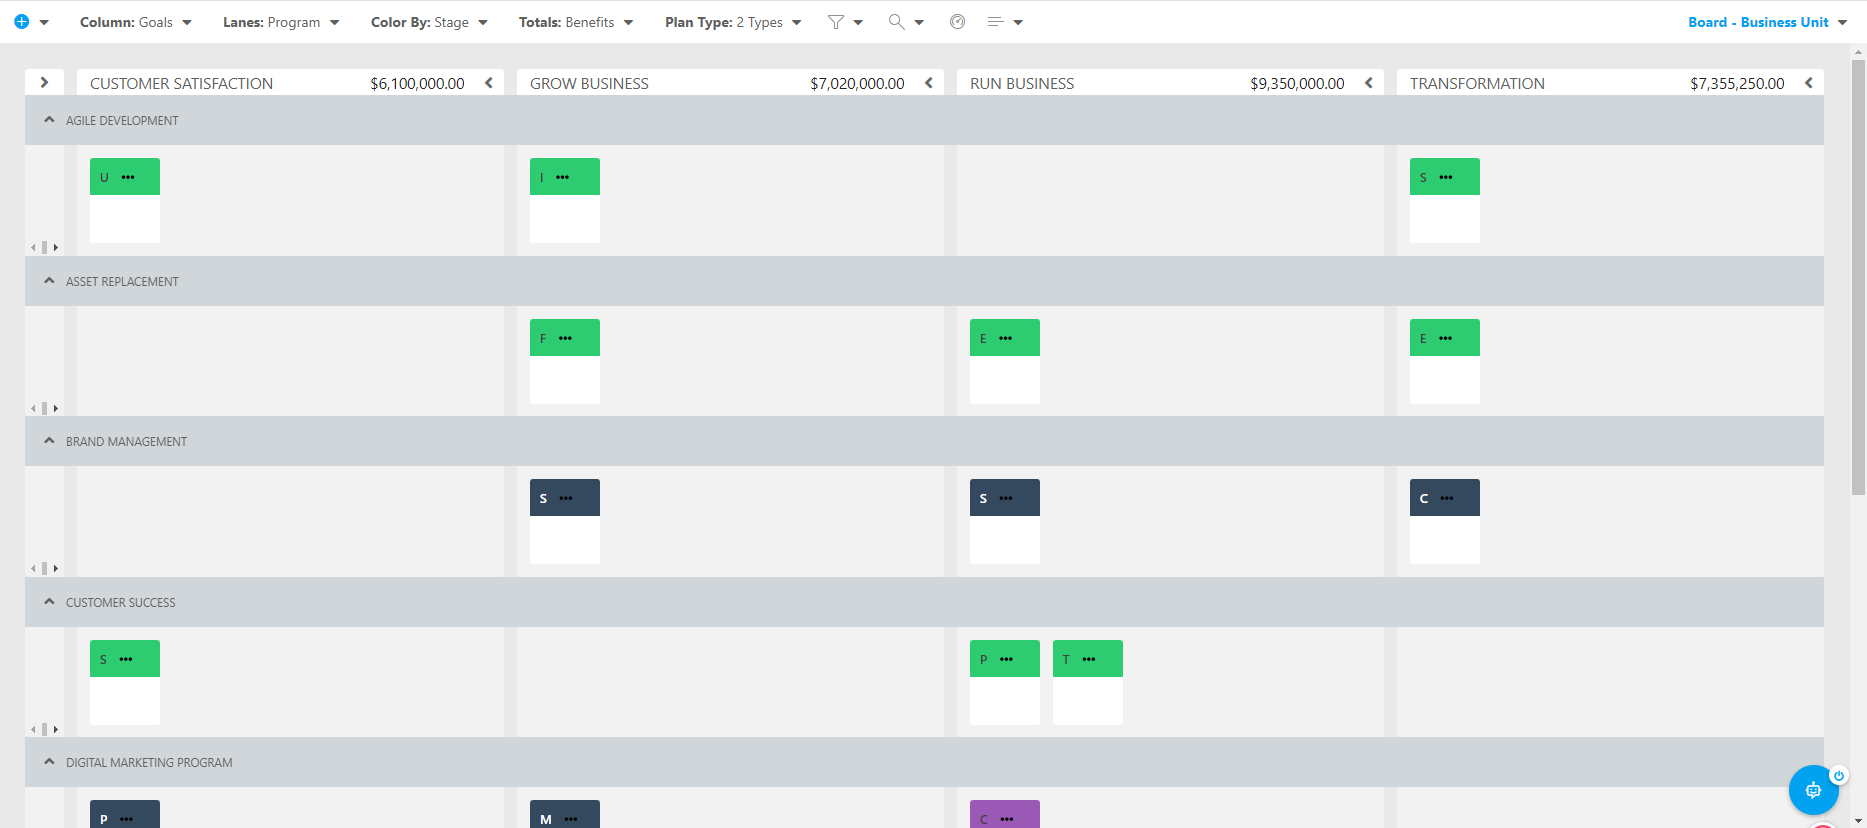
In this example, each column on the board represents a Business Unit (IT, Product Development, and Marketing in this example).
At the top of each column, you can see the total budget of all of the items within each column. So, for example, here you can see the total Budget (see the Totals setting in the header) of all of the items in the IT column equals $3,919,245.
Each card in the columns represents a project or epic in your portfolio. The cards are color-coded by the project or epic Status (out of the box, green = On Track, yellow = At Risk, red = Off Track).
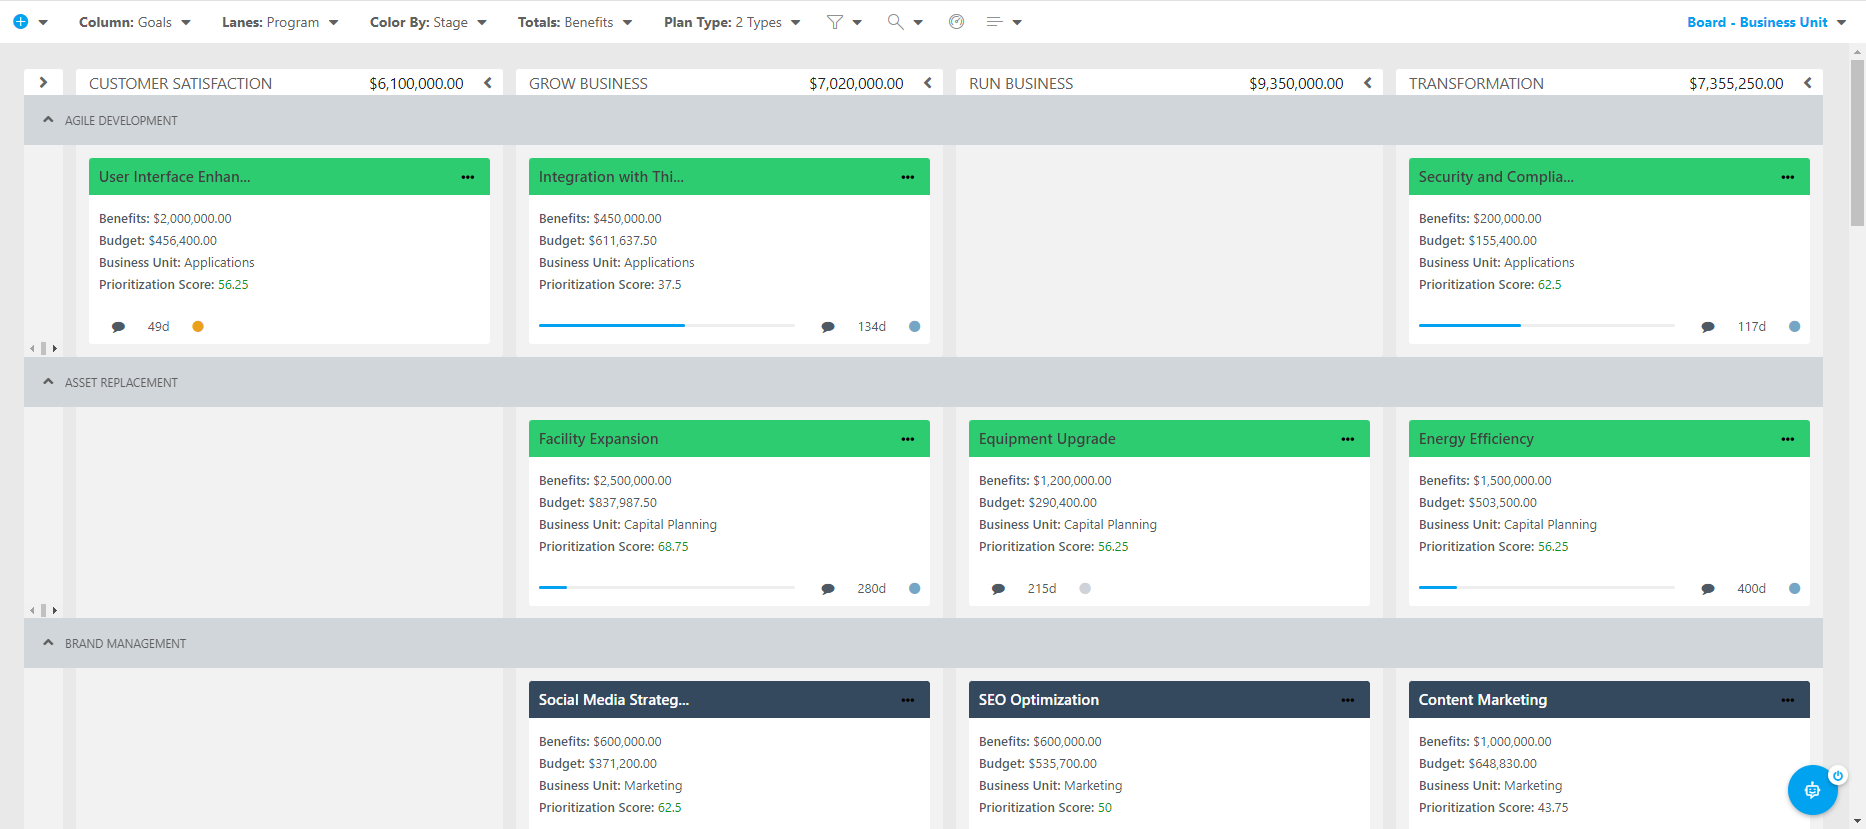
The cards also display some general information about the project or epic, including the Benefits, Budget, Business Unit, and Prioritization Score.
At the bottom of each card, you can see a bar displaying the project or epic overall % Done, how many days the project has been in a particular stage, and a color-coded dot representing the project or epic State (out of the box, light gray = Proposed, blue = Active, yellow = On Hold, dark gray = Closed). There is also a speech bubble icon you can click to add comments for a project or epic.
The lines connecting different cards on the board represent dependencies between various projects or epics. The direction of the arrow shows the direction of the successor/predecessor relationship, with the arrow pointing at the predecessor. The color of the line represents the method of the relationship, with blue lines representing regular dependent relationships, and red lines representing blocker relationships.
All of these settings are configurable so you can personalize the Portfolio Board in a way that works best for you.
Customize the Portfolio Board
Now that we have walked through an example of a Portfolio Board configuration, let's dive into how you can configure the board for your use.
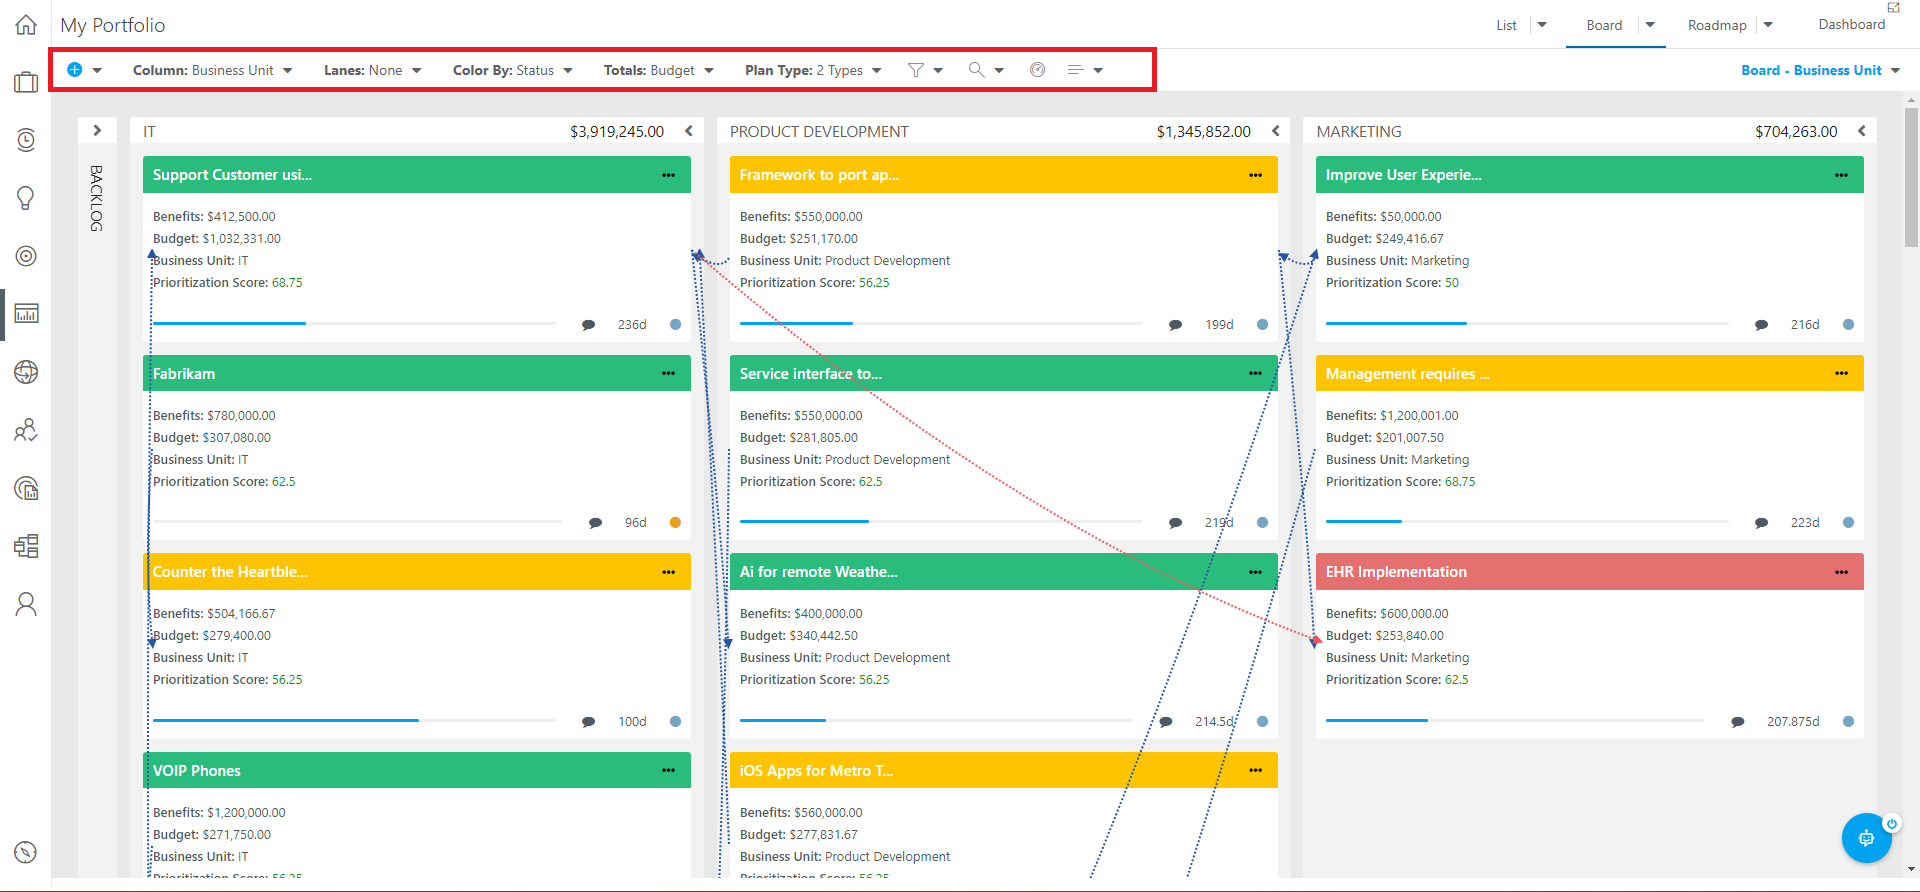
All of the board configuration settings are available here in the board header.

New Plan
 : Click to create a new plan in your Portfolio. If you create a new plan from the board view, it may not display on the board immediately, as the new plan will likely not fit into the board view configuration. If you would like to view the new plan on the board, you need to go to the Portfolio List view, locate the new plan, and update the plan information so it fits into the columns and lanes of the board.
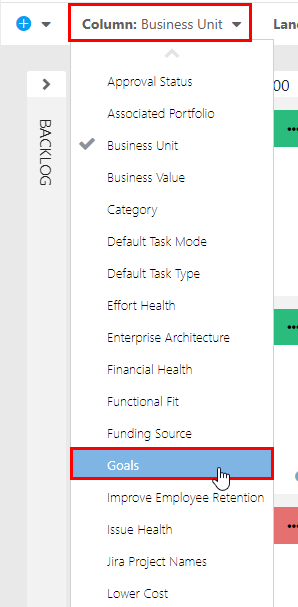
Column: Select the plan field want to use for the columns in the board. For example, I will click on the Column menu, and select Goals from the drop-down. Now the Goals plan field will be used for the columns in the board.

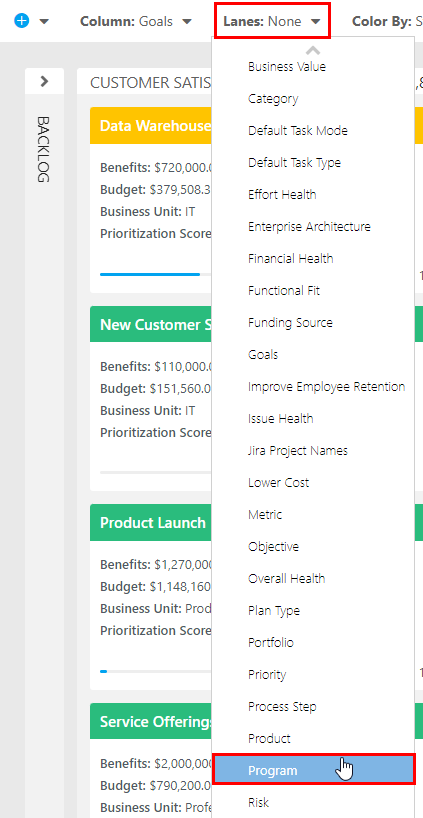
Lanes: Select the plan field want to use for the lanes in the board. For example, I will click on the Lanes menu, and select Program from the drop-down. Now the board will have swim lanes to group the cards by the Program they belong to.
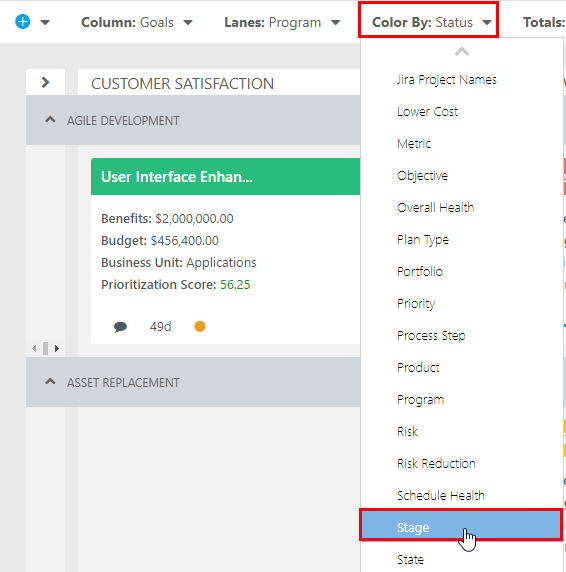
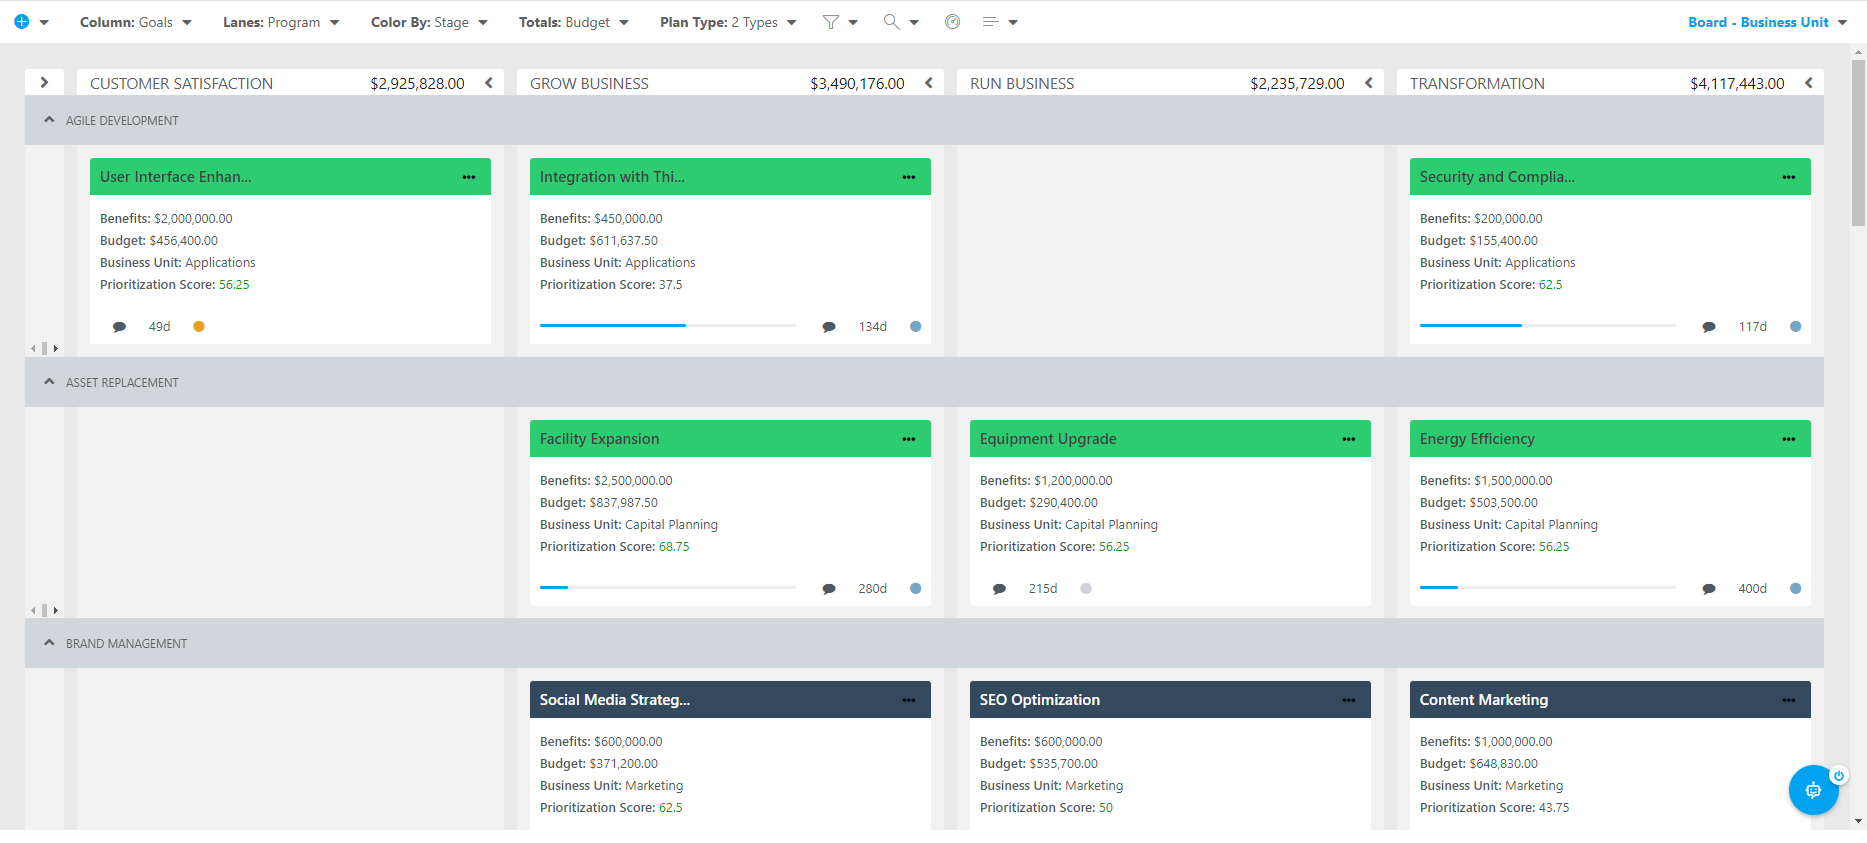
Color By: Select the plan field want to use to color-code the cards on the board. For example, I will click on the Color By menu, and select Overall Health. Now the cards on the board will be color-coded by the project or epic Stage.
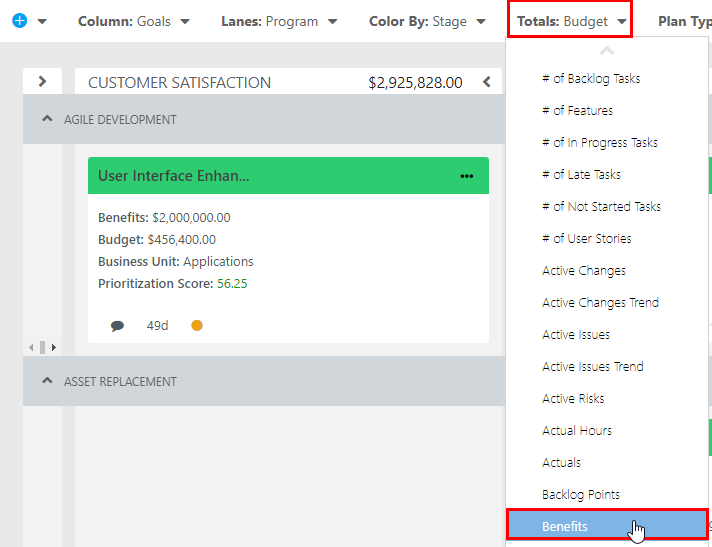
Totals: Select the plan field want to use as the column totals. For example, I will click on the Totals menu, and select Benefits from the drop-down. Now the column total value is a sum of the Benefits values of all of the projects and epics in the column.
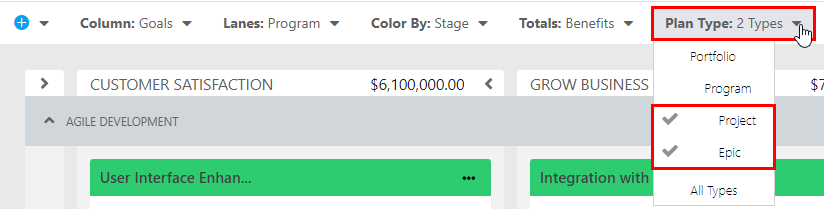
Plan Type: Select the plan types you would like available on the board as cards. For example, I will click on the Plan Types menu, and in the drop-down, you can see that I could display Portfolios, Programs, Projects, and Epics. These are the different plan types that are available in the My Portfolio area currently. Here I will select Projects and Epics. This means that all of the cards on the board represent a project or epic from my portfolio of work.
Filter
 : Select plan fields to use as filters to limit the number of items that appear in the board. For example, I might set a filter on the Status field, and only load in projects and epics that have a Status of On Track.
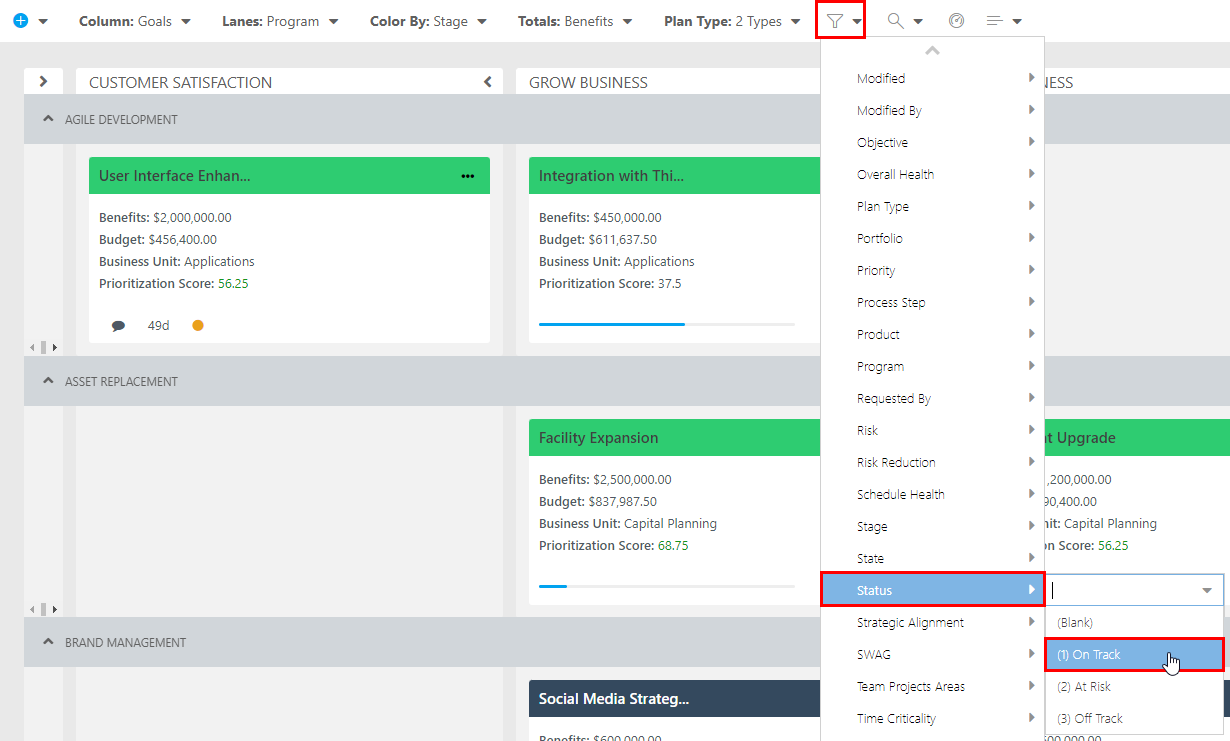
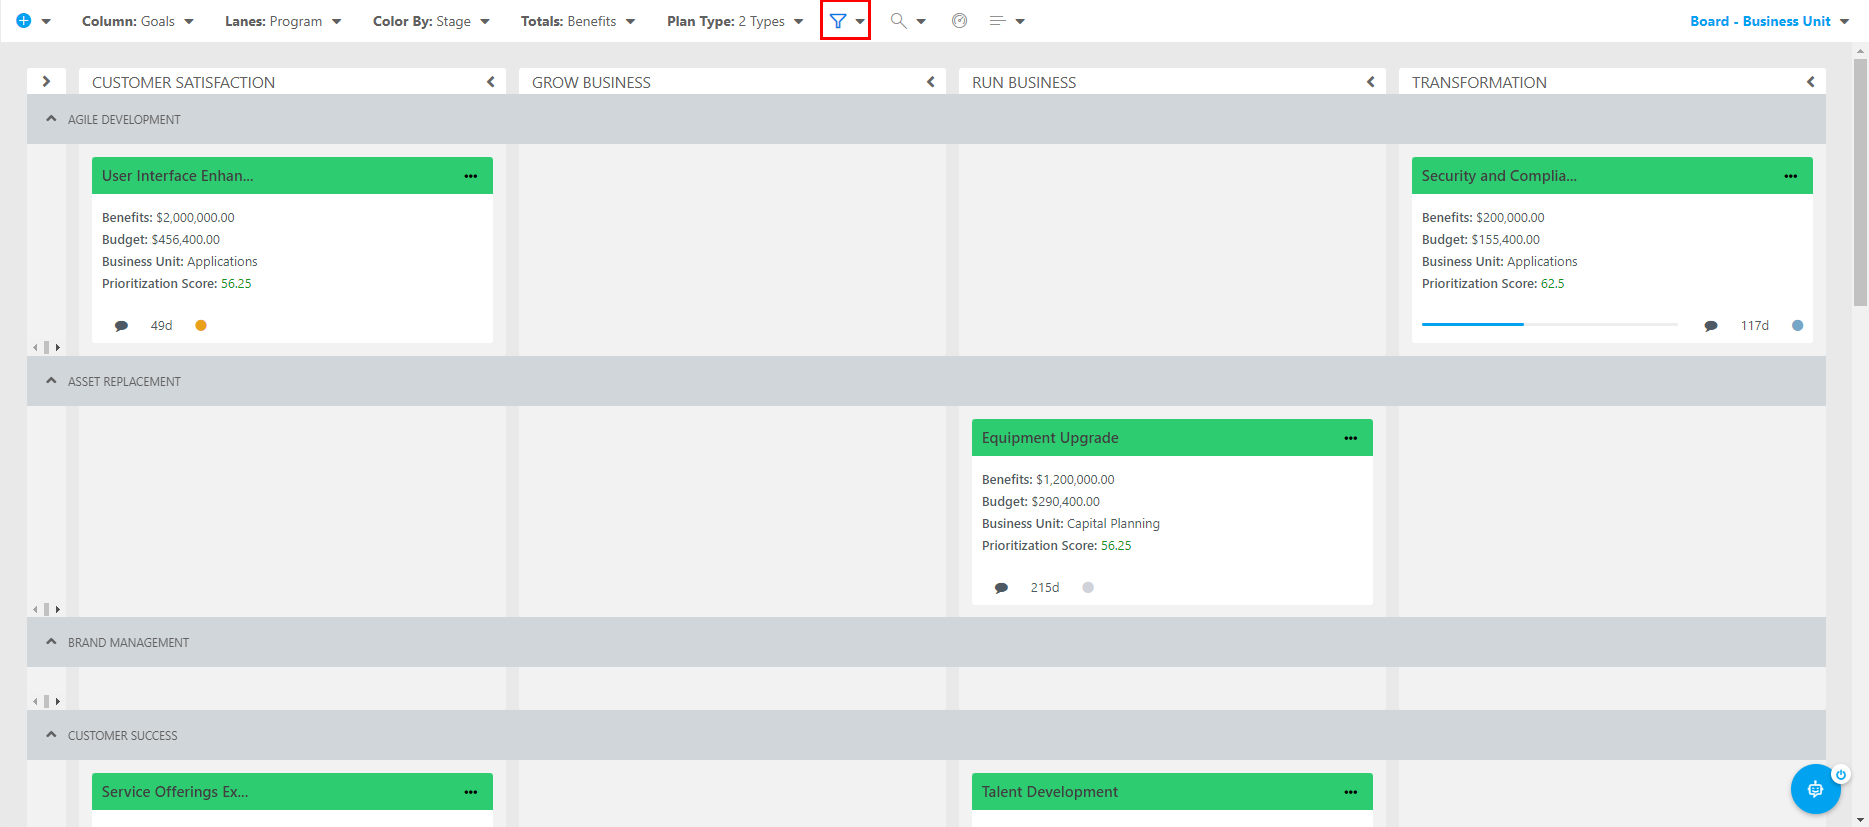
In the screenshot below, you can see the board with the Status > On Track filter applied. Notice that the Filter icon is highlighted blue. This means that there is a filter applied. To remove the filters, simply click on the Filter icon, then select Clear Filters (the first option in the Filter drop-down). This will remove all filters.
Zoom
 : Select the size of the cards on the board. Options here include Small, Medium, and Large. Large is the default size.
Small cards look like this:
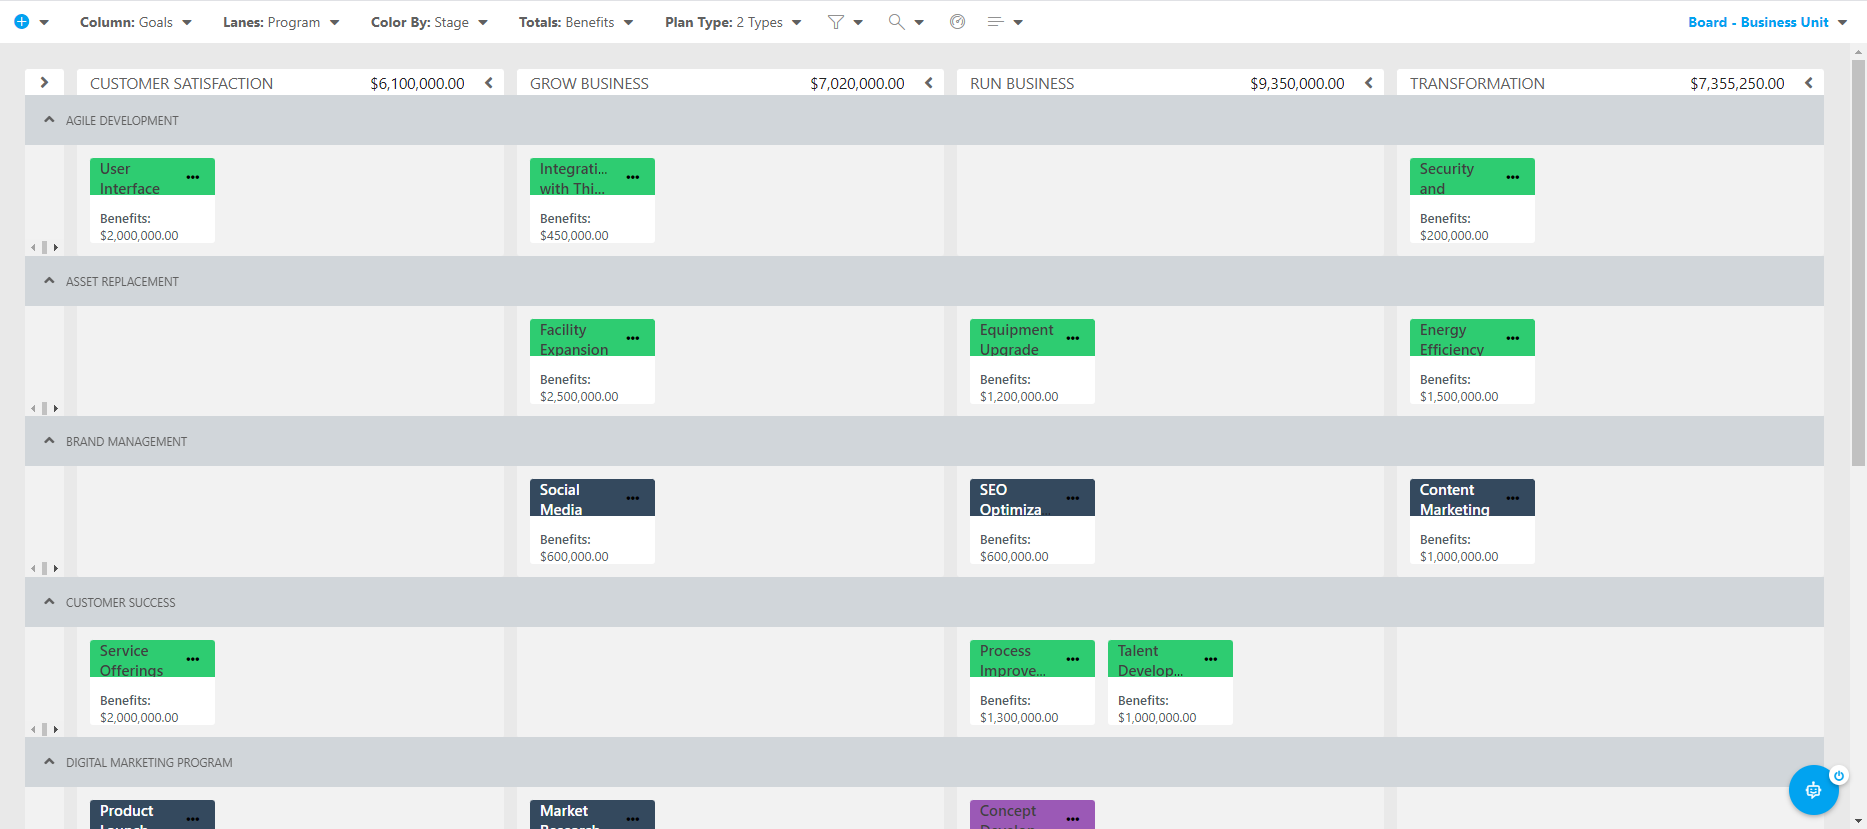
Medium cards look like this:
Large cards look like this:
Constraints
 : Set the constraint values for the columns in the board to run some light what-if scenarios. The constraints are based on the value you selected for the Totals. So, in the example I've been using throughout this article, the Totals, and thus the Constraints, are based on the Benefits values of the projects and epics in the board. To set constraints in the board:
Click on the Constraints icon, the Edit [Selected Totals] Constraints form will open.
Select the Constraint Goal. Options include None, Above Constraint, or Below Constraint. Because in this example I am working with Benefits as my Total values, I want to be above the constraint value I will set, as more benefits from projects and epics = more money for the organization. So, I will select Above Constraint.
Set the constraint values for each column. Again, I am working with Benefits in this example. So for each column, I want to set the minimum benefits I want to see from all of the projects and epics in a column. To set these constraint values, click into the Constraint field for each column, and enter the desired value.
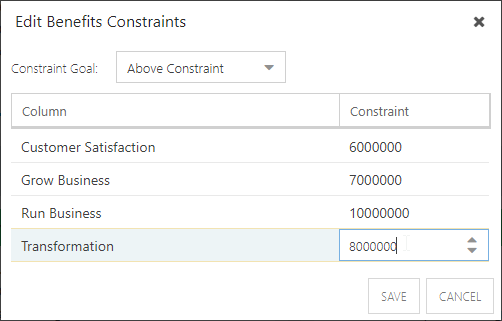
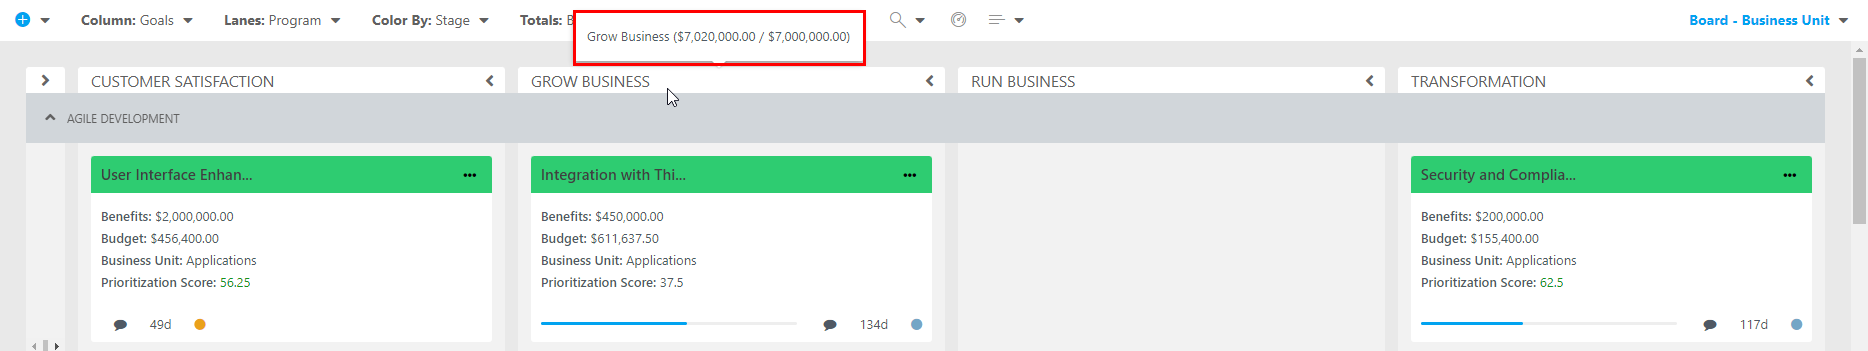
Once the constraints are all set, click Save. Now, when you hover over the column title, you can view the column Total value compared to the column Constraint value to see if you are hitting your goals.
Fields
 : Select the plan fields you would like displayed on the cards on the board. Out of the box, the Benefits, Budget, Business Unit, and Prioritization Score fields are displayed on the cards. For this example, I will also add the Funding Available and Overall Health fields to the cards. To do this, click on the Fields icon, then select the desired fields (Funding Available and Overall Health) from the drop-down. The data from the selected fields will now be displayed on the cards on the board.
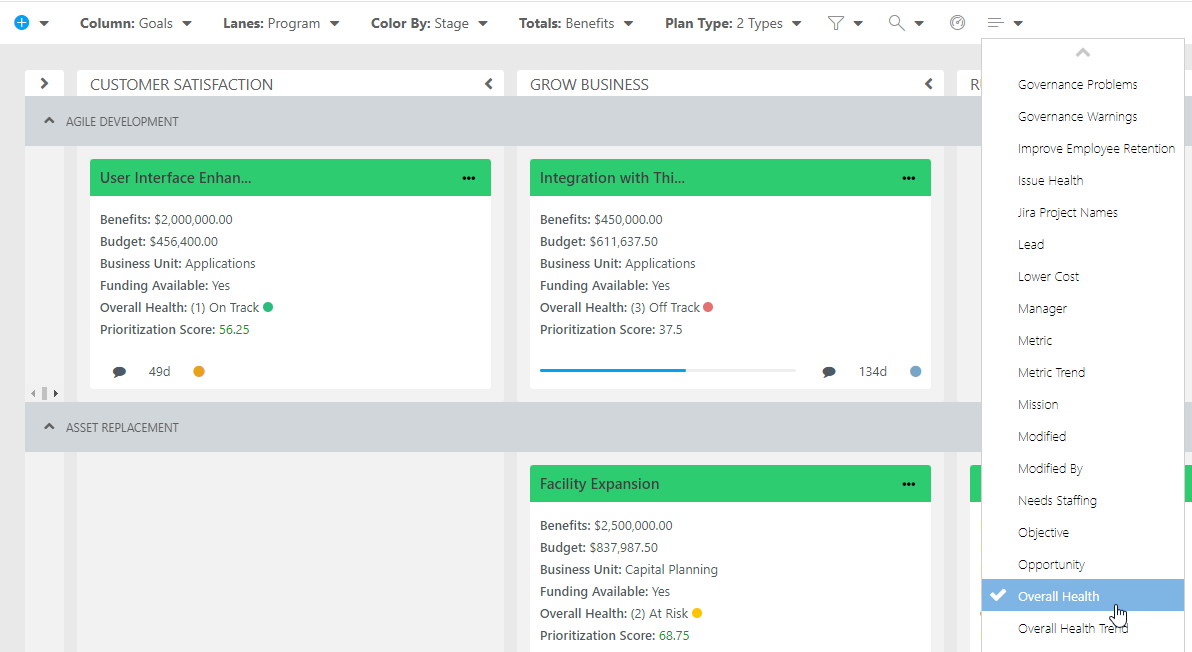
Save a Board View
Now that we have the Portfolio Board configured to our liking, we can go ahead and save this view for later use. To save a view:
Click on the Views menu. Then select Save Board.
The Save View form will open. Complete the form.
Enter a name for your view.
If you are an Admin, you will see the Personal View check box. Check the check box if you want the new view to be a personal view only. Otherwise the view will be a Global view for all users in your OnePlan environment.
Note
If you do not have Admin permissions, you will NOT see the Personal View check box, and every board view you save will be a personal view.
Check the Default View check box if you want the new view to the the default view that loads when you go to the Portfolio Board.
Click Save. Your new view will now be available in the Views menu.