Use the Gantt in the Portfolio Area
This article explains how to access and analyze the Portfolio Gantt.
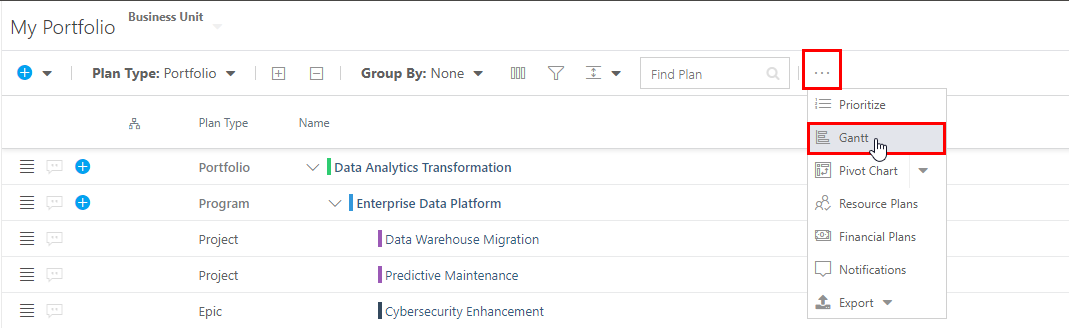
To access the Gantt click on the Widgets button in the Portfolio header, then select Gantt. The Gantt will open in the right half of your window.
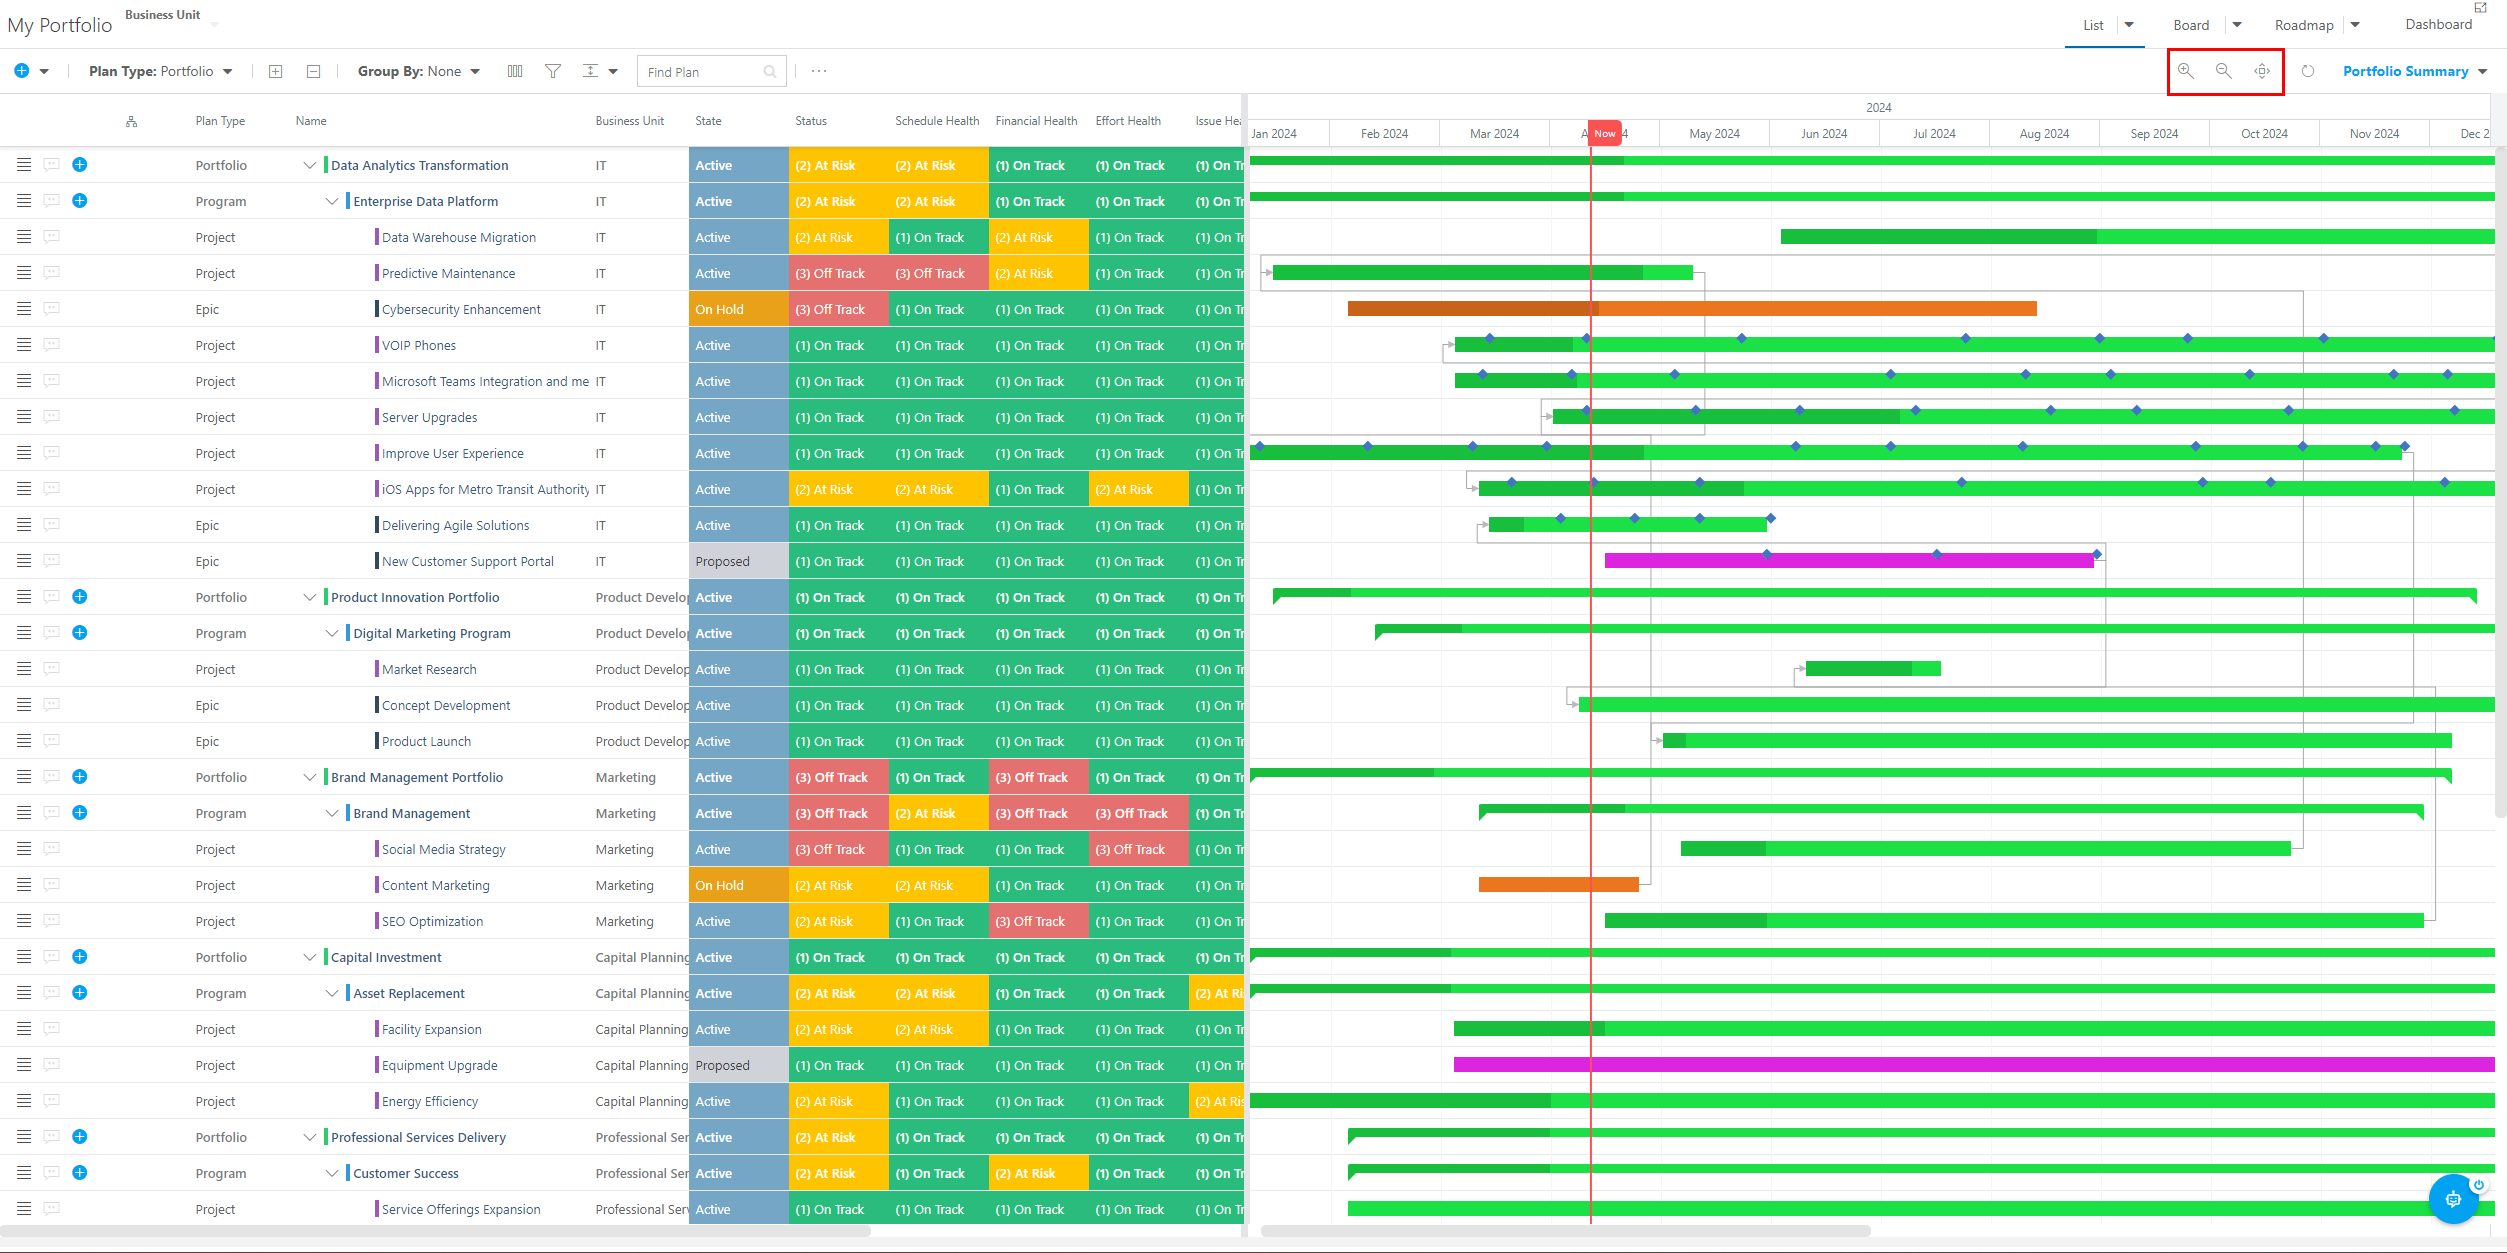
When the Gantt chart is open, additional icons will show for Gantt view controls including Zoom In, Zoom Out, and Zoom Fit.
Looking at the Gantt, there are a few items to note:
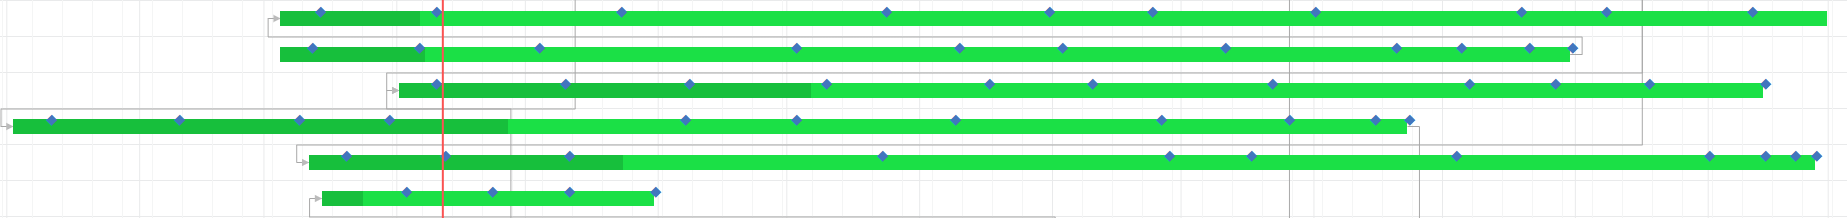
Each bar represents a plan in the Portfolio. The bars' coloring is determined by logic set up by your OnePlan administrator. The length of the bars correlates to the duration of the plan.
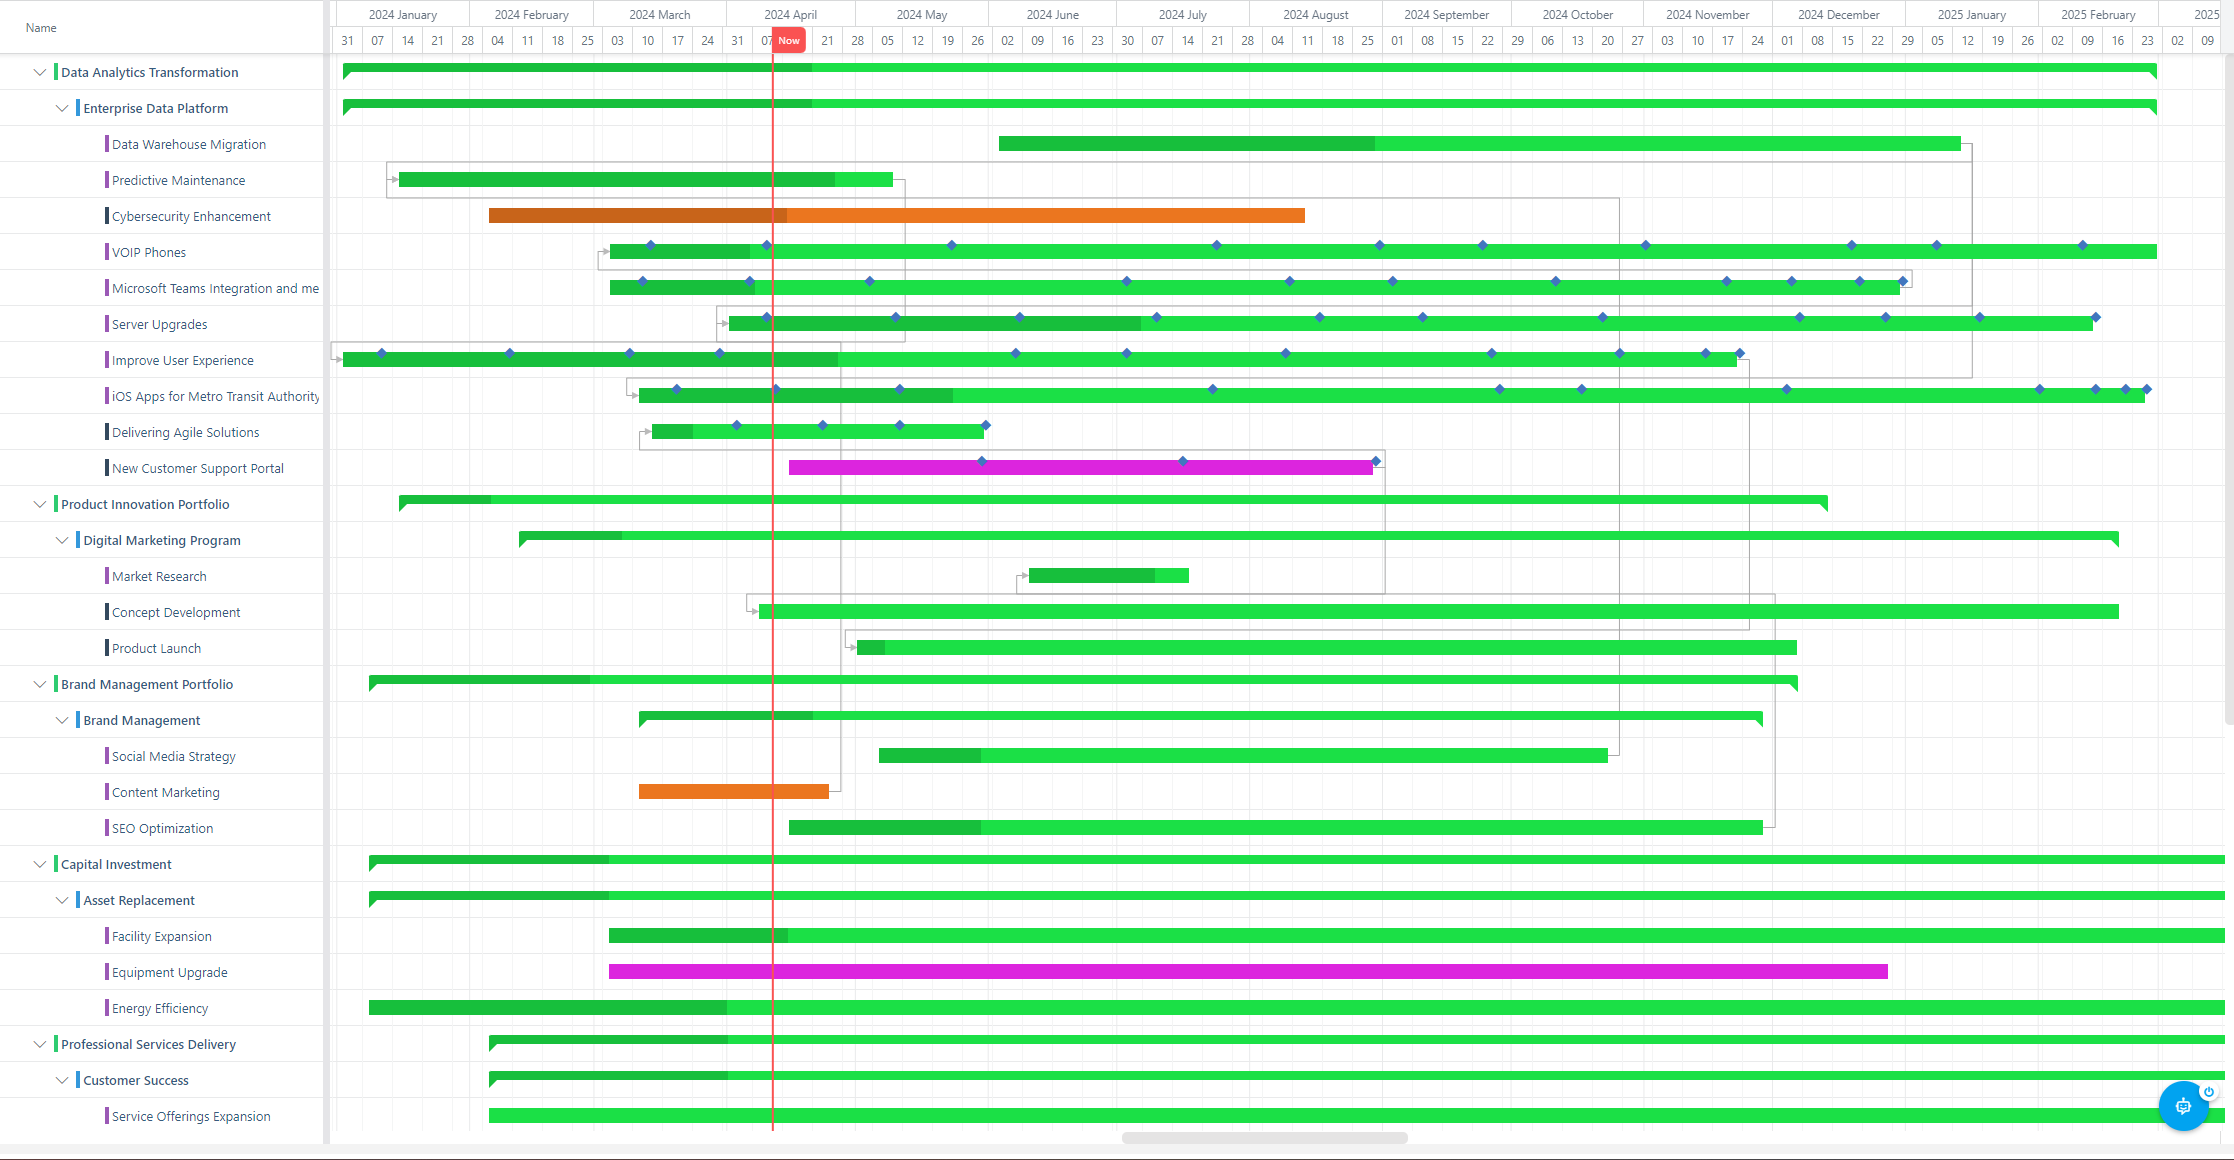
Milestone events are represented by diamonds on the Gantt bars.
Relationships between plans are represented by a gray line connecting two plan bars.
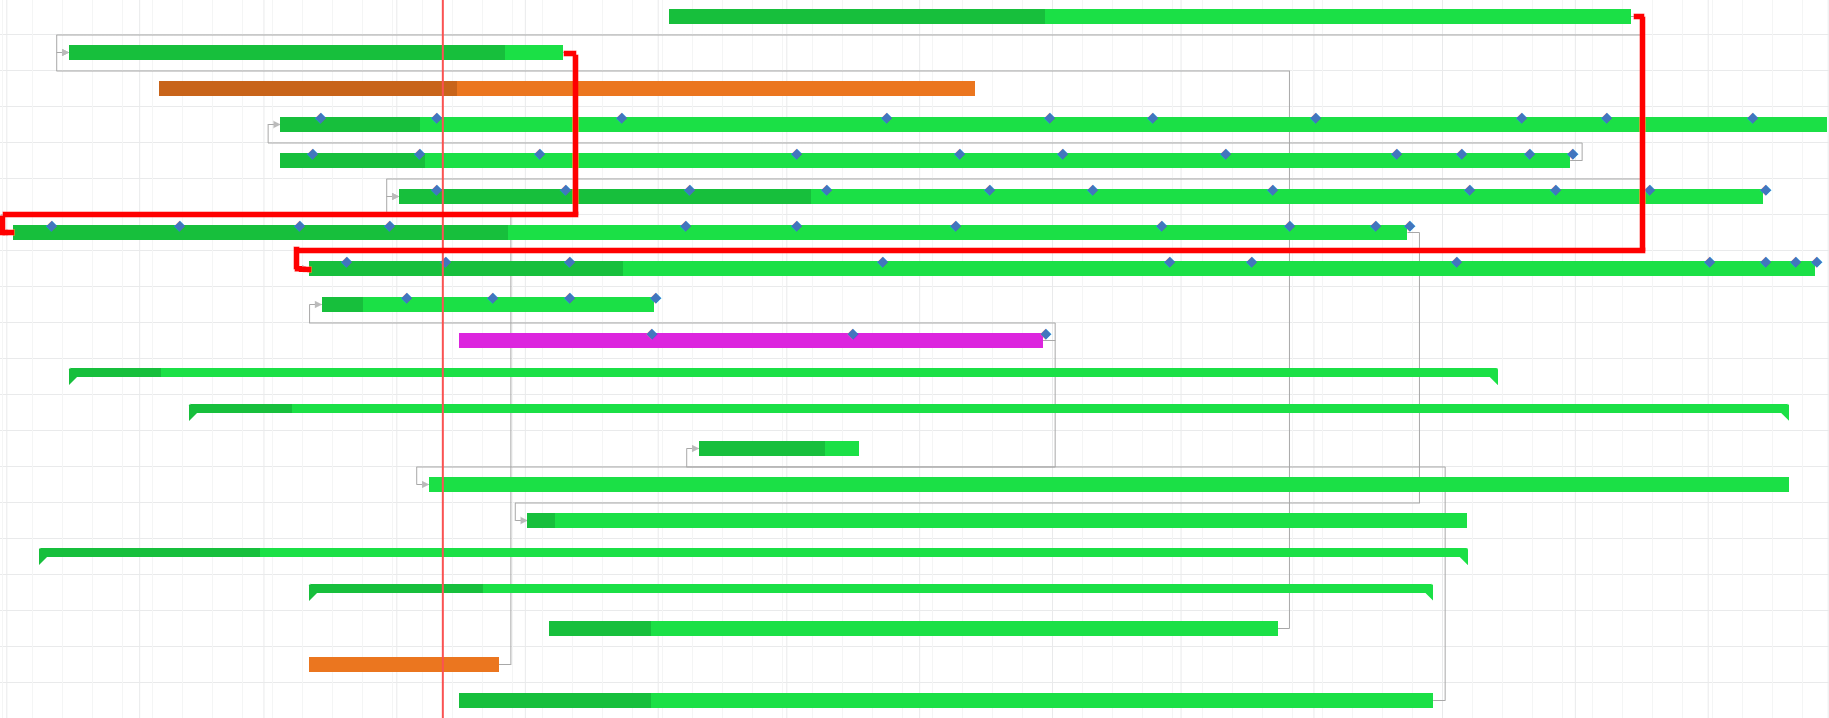
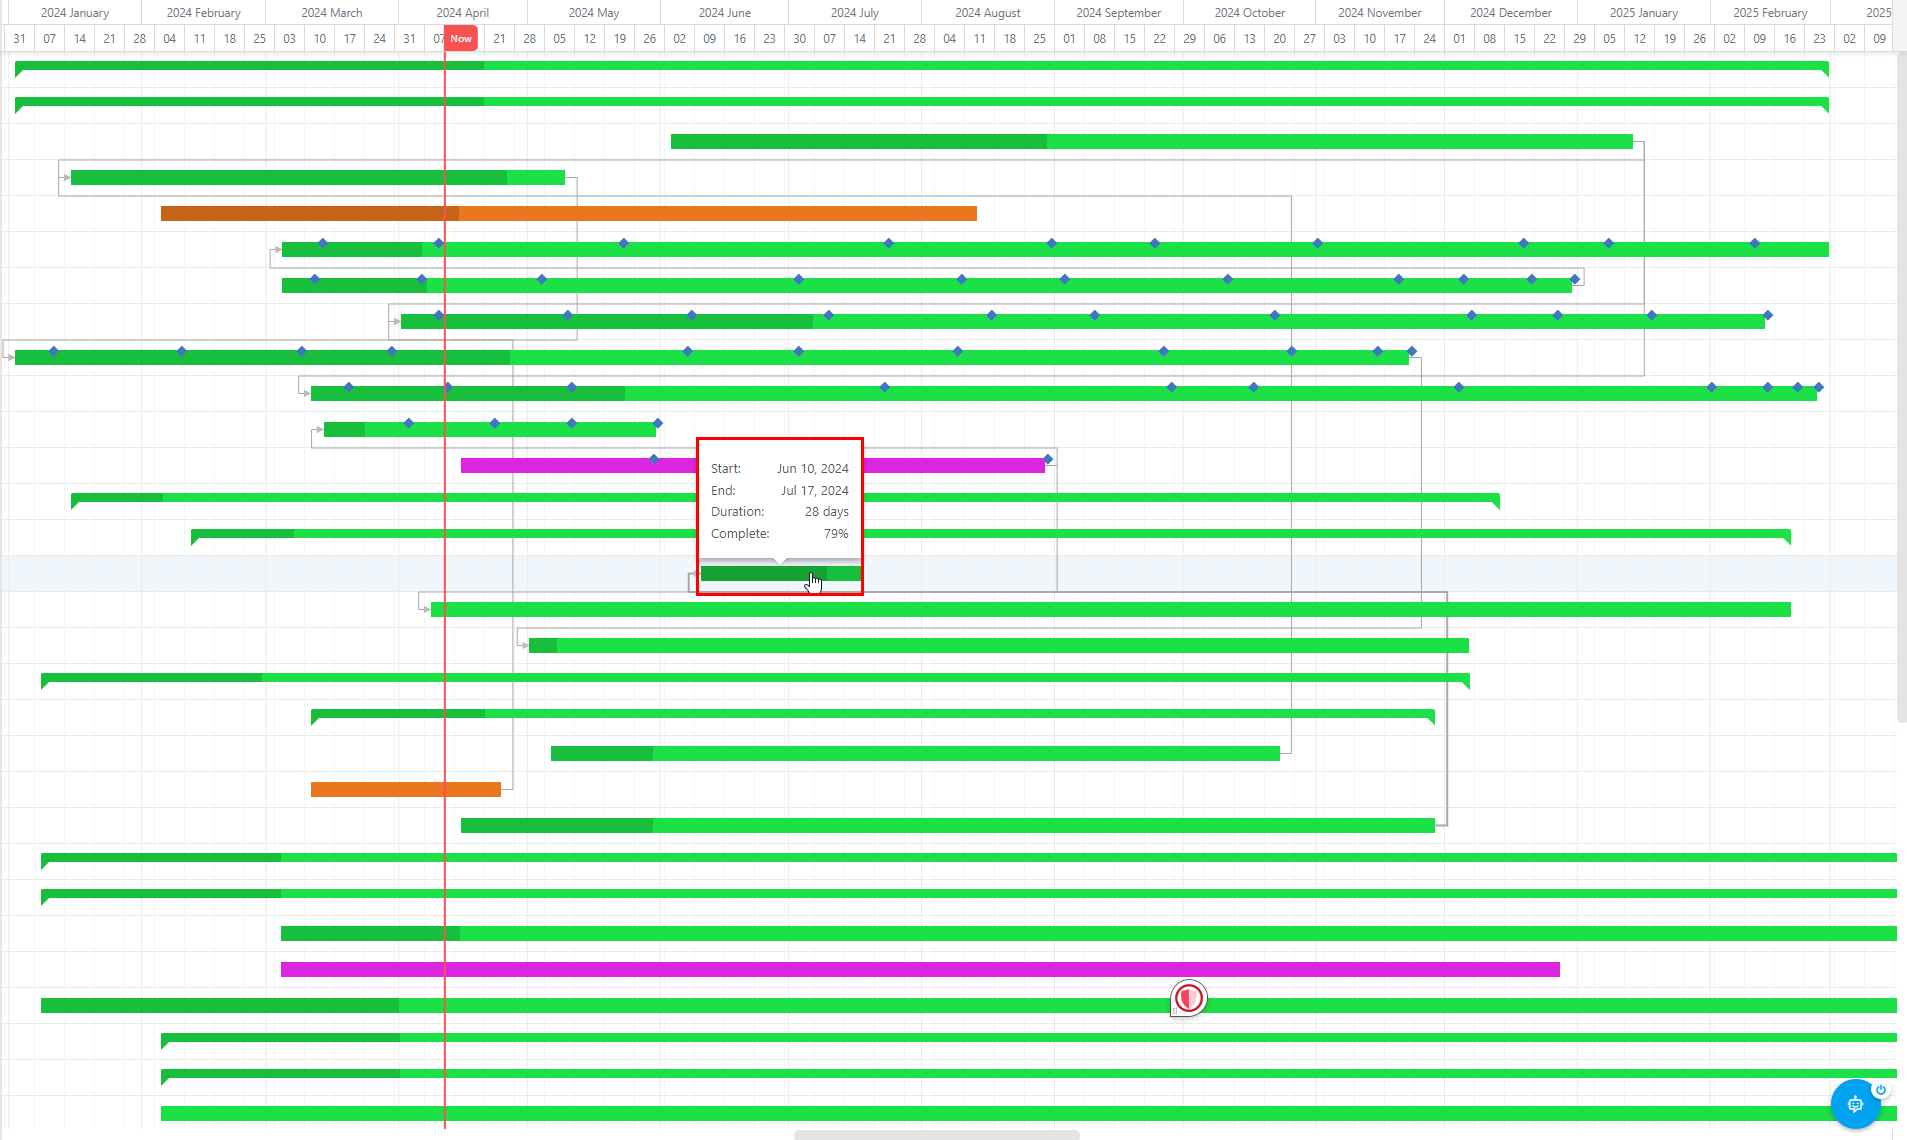
Hovering your cursor over the bars, diamonds, and dependency lines will bring up a tooltip, giving you some general information on the plan, milestone, or relationship.