What are the Financial Plan menu options?
This articles explains the various menu options for viewing and building financial plans.

Submit

Select a row in the financial plan. Click the Submit button. If approvals are turned off, the row status will change to submitted. Should any data in the row change, the status will change back to unsubmitted.
Cost Types
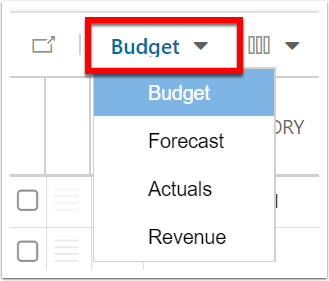
Select the Cost Types drop down menu to toggle to another cost type. When viewing any additional cost types or comparing cost types, the one selected in the Cost Types drop down menu is the one that remains editable (if it's an editable cost type).
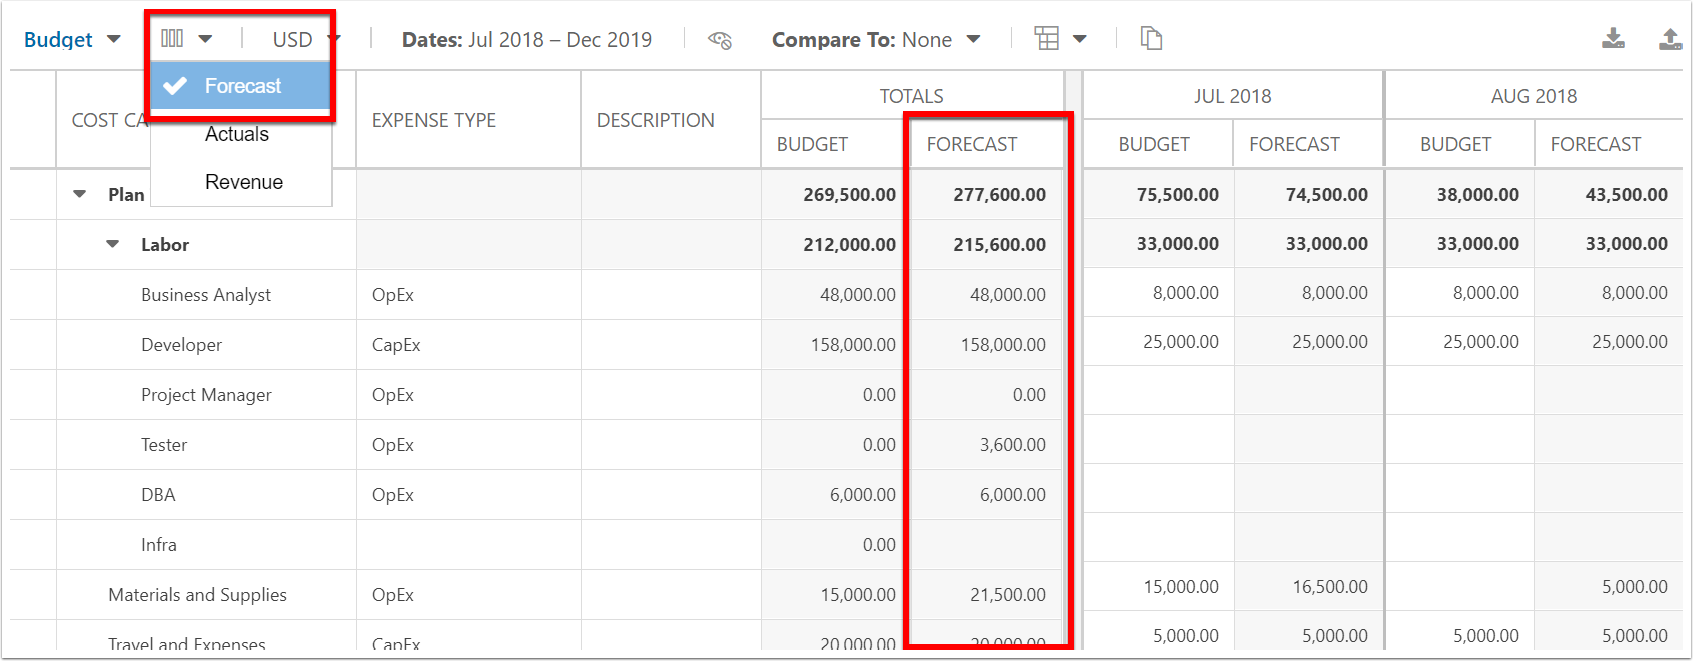
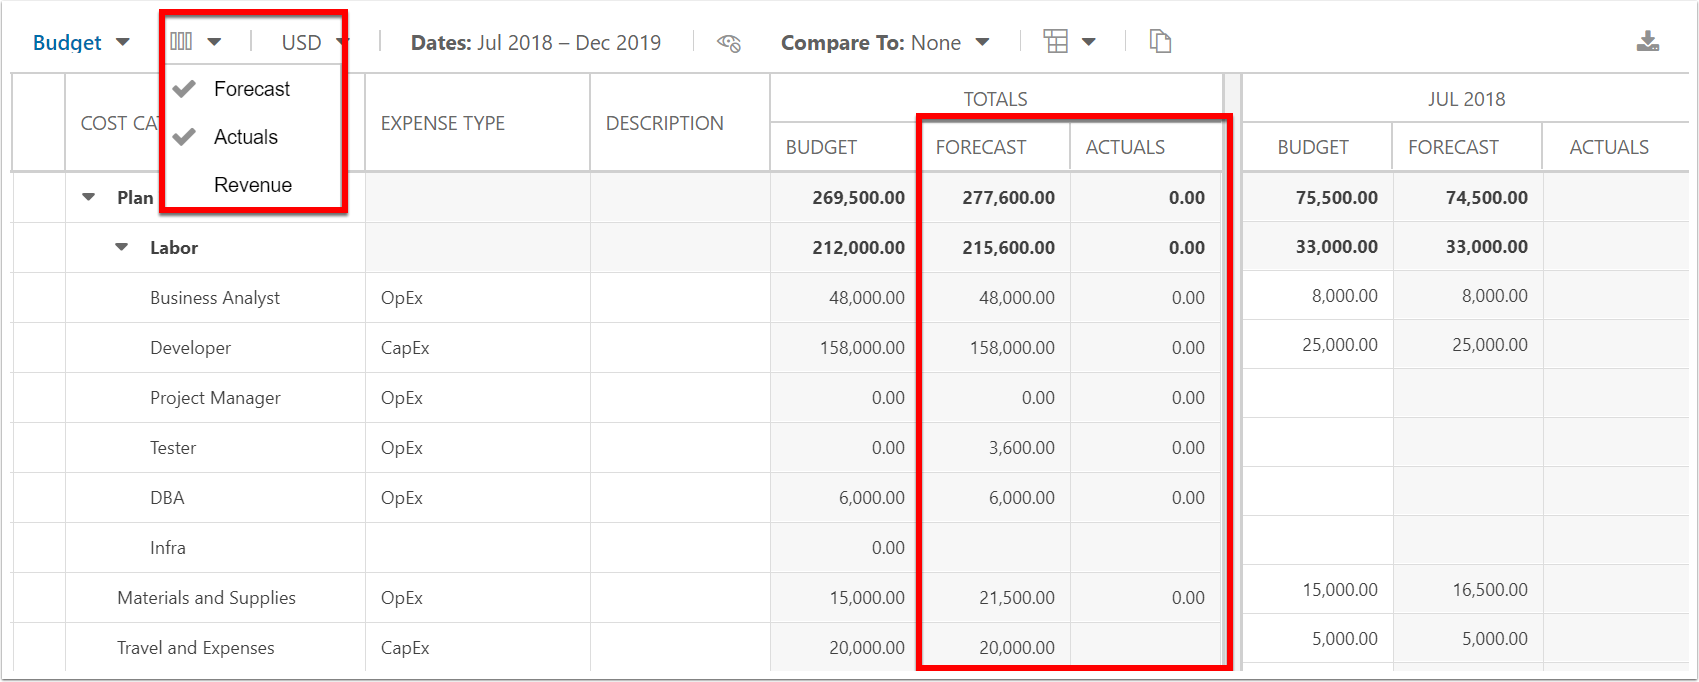
Additional Cost Types
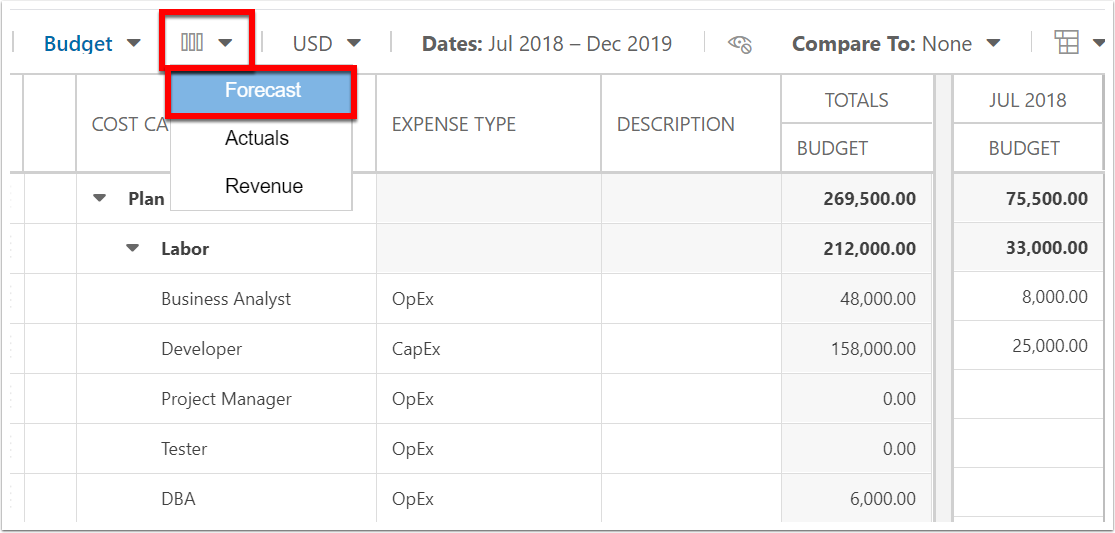
Should you want to see two or more cost types side-by- side, select the cost type from the Additional Cost Types button. Note, your main cost type is the editable one, whereas the additional cost type(s) will be view only. You would go to that other cost type to update it if needed. Each cost type selected will show side-by-side in the Totals section and each time-phased period.
Currencies
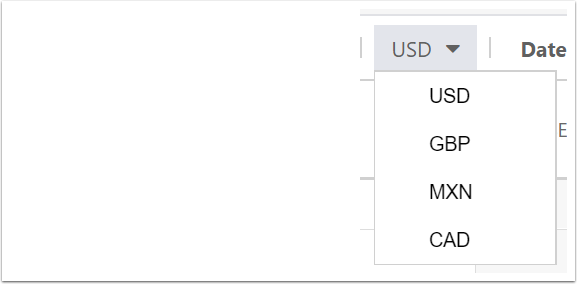
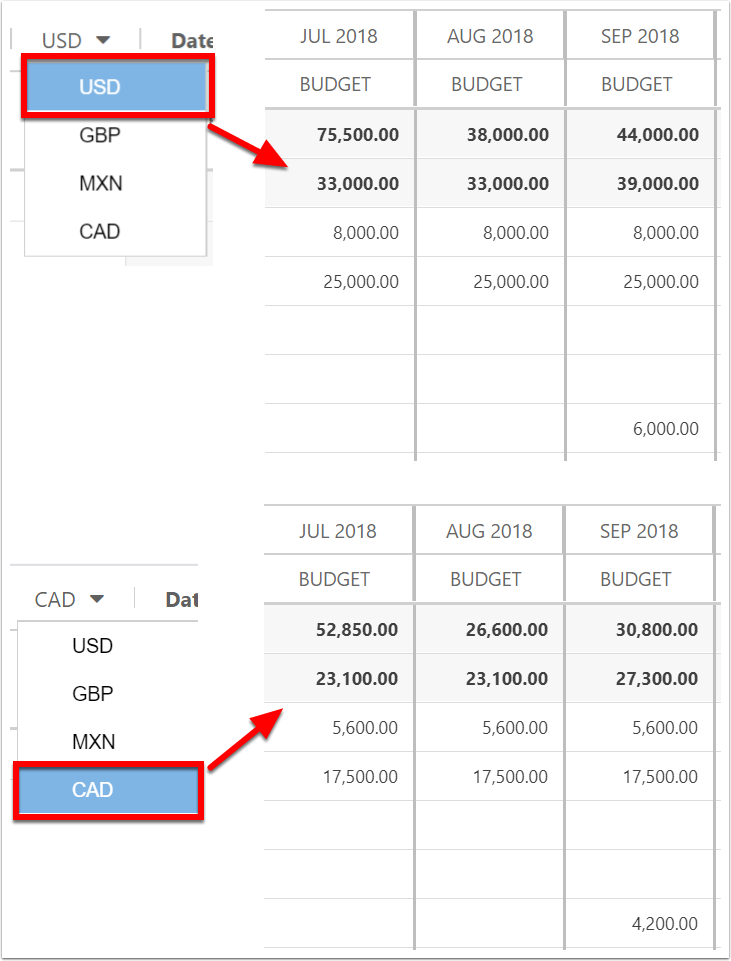
If your organization uses different currencies & has them configured, you can toggle between them here. The currency conversions are configured by the admin. Enter costs in the preferred currency. When you toggle to a different currency, the values will adjust per the currency conversion tables.
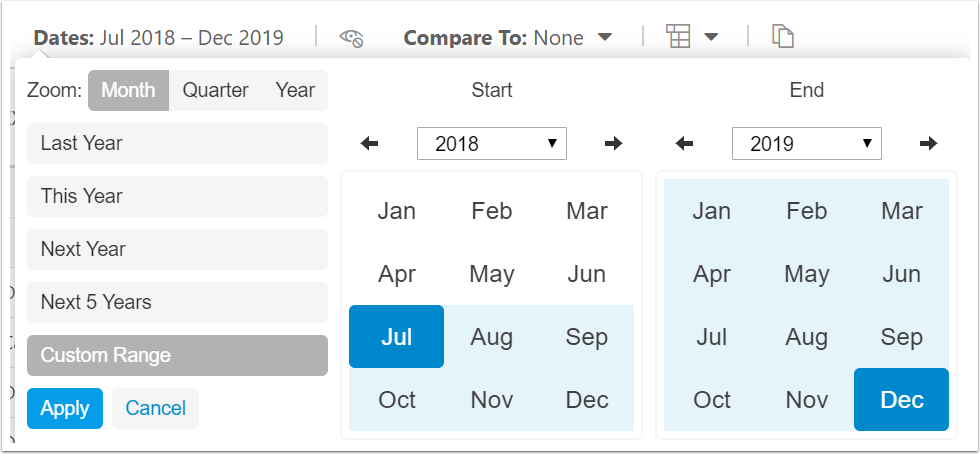
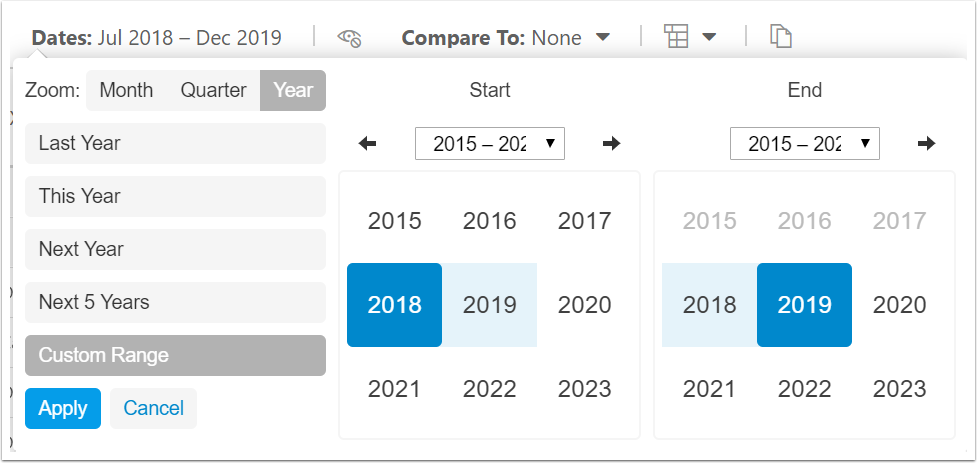
Dates
Change the Date Range of your view as needed. Select one of the preset date ranges such as Last Year, This Year, Next Year, or Next 5 Years.
Or, set a custom range, zoom to Months, Quarters, or Years, then select the time frame desired. Then, click the Apply button.
Monthly
Quarterly
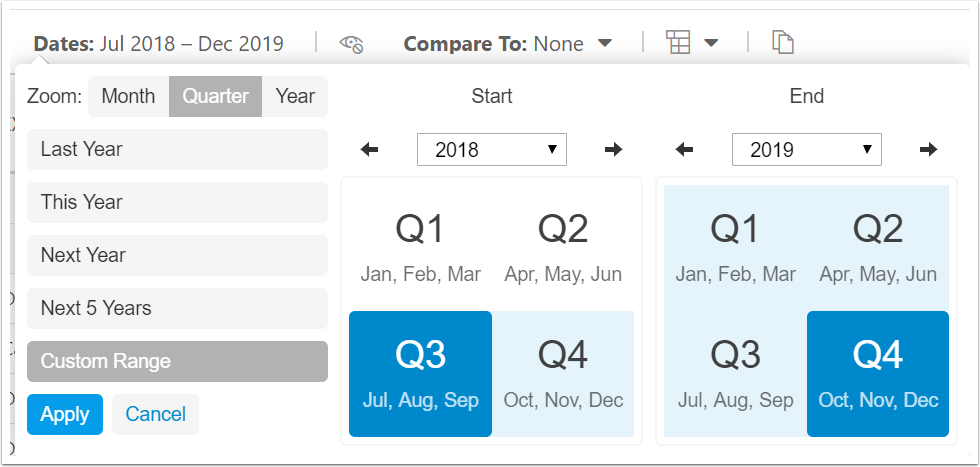
Yearly
Compare To (Cost Type)
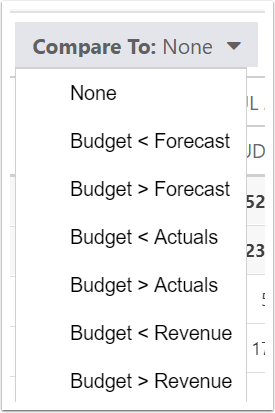
Compare values across two cost types. Select Compare To, then two cost types to compare. You may only compare two cost types at a time.
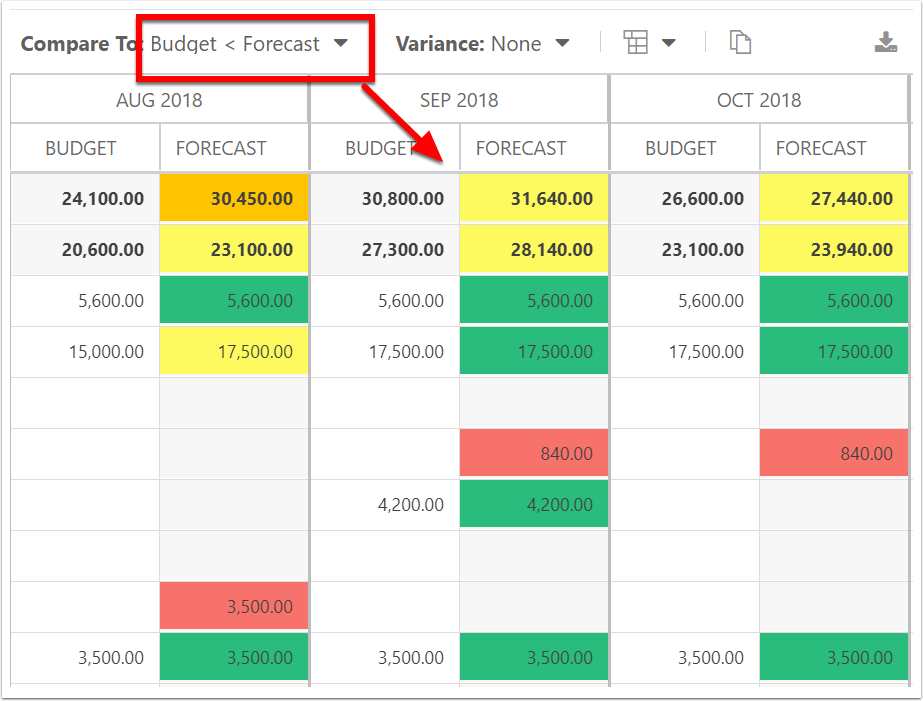
The values for both cost types will show side-by-side. Note, your main cost type is the editable one, whereas the comparison cost type(s) will be view only. If you change a value in the main cost type, the colors will update according to the variance rules in real-time. You would go to that other comparison cost type to update it if needed. Each cost type selected will show side-by-side in the Totals section and each time-phased period. The carrot direction determines whether the greater than or less than will determine the logic for the color scale green or red. In the example above "Budget < Forecast," the forecast column will turn yellow then red when the forecast is greater than the budget cost type. Here is the formula for when the colors change:
The calculation currently is |value1-value2|/((value+value2)/2)*100
Colors are (based on the percentage variance):
>120% red
>110% Orange
>100% yellow
<= 100% green
Variance
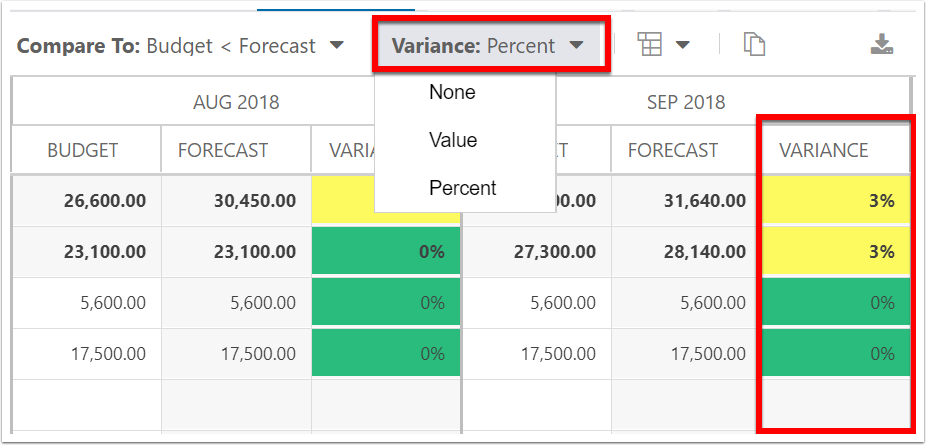
When comparing cost types, you may select a type of variance to show. Select the Variance drop down for the options: None, Value, or Percent. When a variance type is selected, the colored cells become the variance column rather than the comparison cost type column.
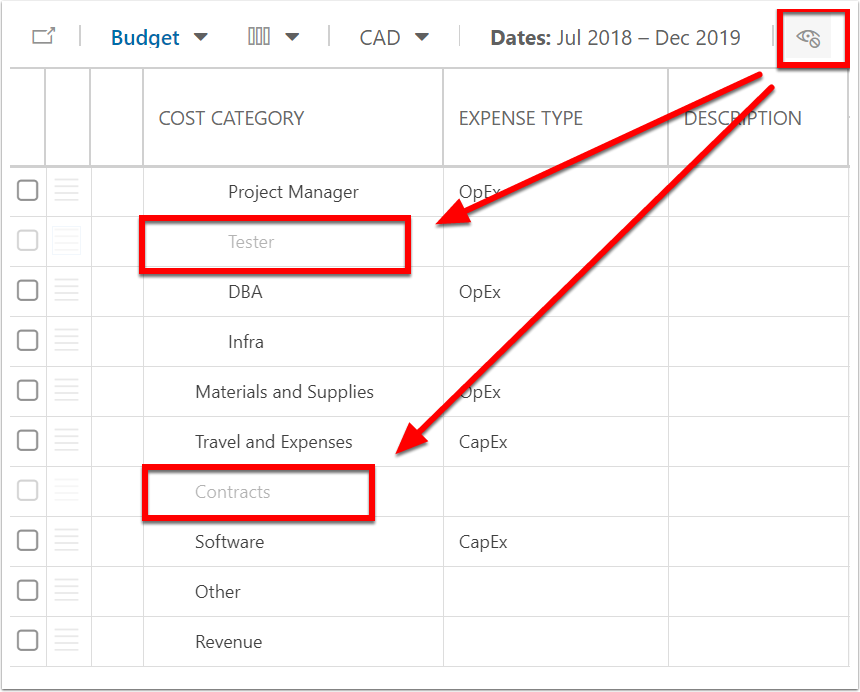
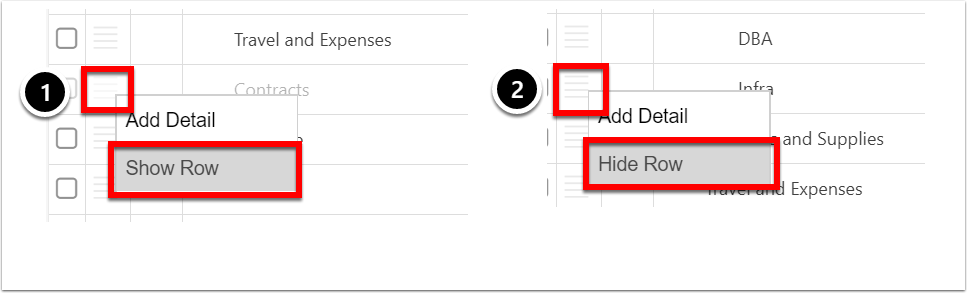
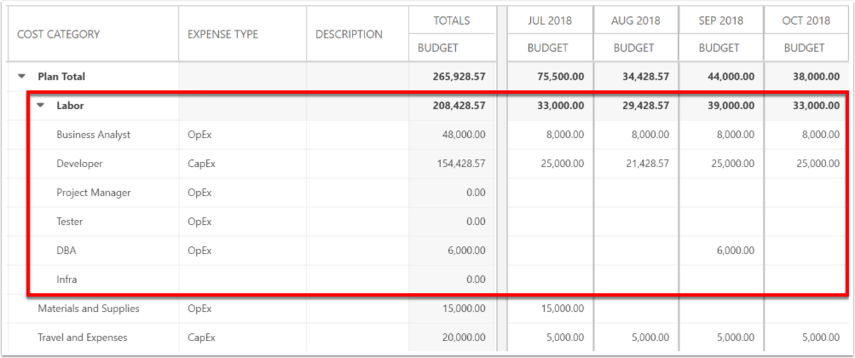
Grouping
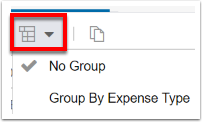
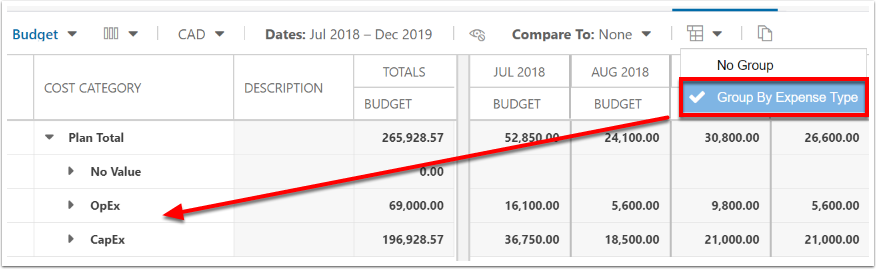
To change the grouping select either No Group or Group By "_____". The default grouping field (if any) is set by your admin. Typically, the additional choice Cost Category fields are available to select for grouping.
Copy Cost Type
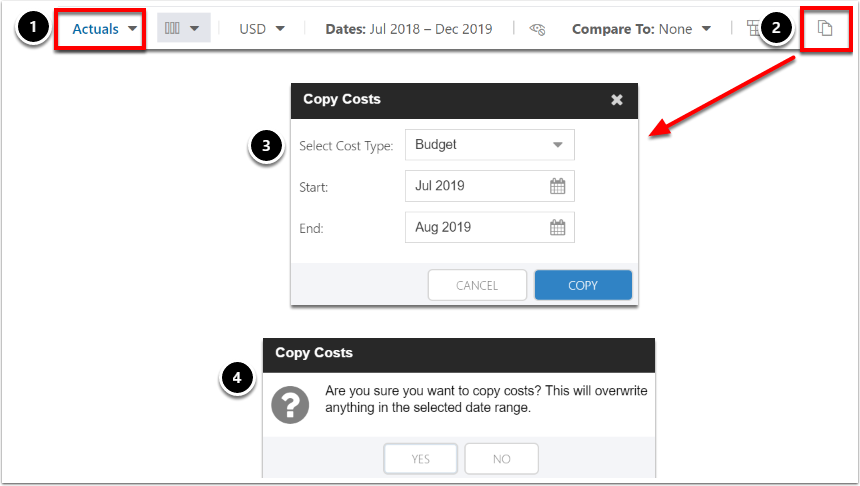
You may copy costs to another cost type as well. For example, once the budget is finalized and approved, you may want to maintain the ongoing estimated costs in the Forecast cost type. Or, as the plan is active incurring costs, you can copy the original budget into the Actuals cost type, then update as needed for each time period. You can copy from any one cost type to another.
Go to the destination cost type.
Click the Copy Costs icon.
Select the source cost type and date range.
Verify to copy costs. The values from all cost categories from the source cost type will copy into the destination cost type.
Import Costs
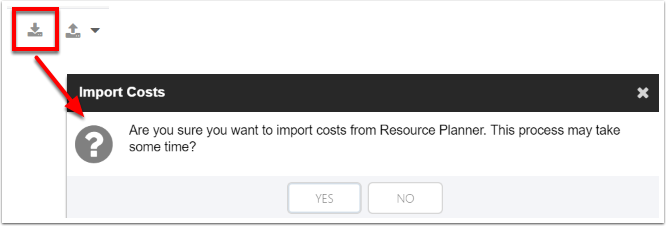
When needed, costs can be imported from elsewhere in the system. For example, importing the committed resource plan hours into budgeted labor costs, or timesheet actual hours into the actual labor costs. Rather than manually entering labor costs, build the Resource Plan. Here the resource plan is filled out. Then back in the Financials page, import the hours, which are converted to costs with each role’s rate.
Be sure you’re in the right cost type, then click on Import Costs & Yes.
Export Costs
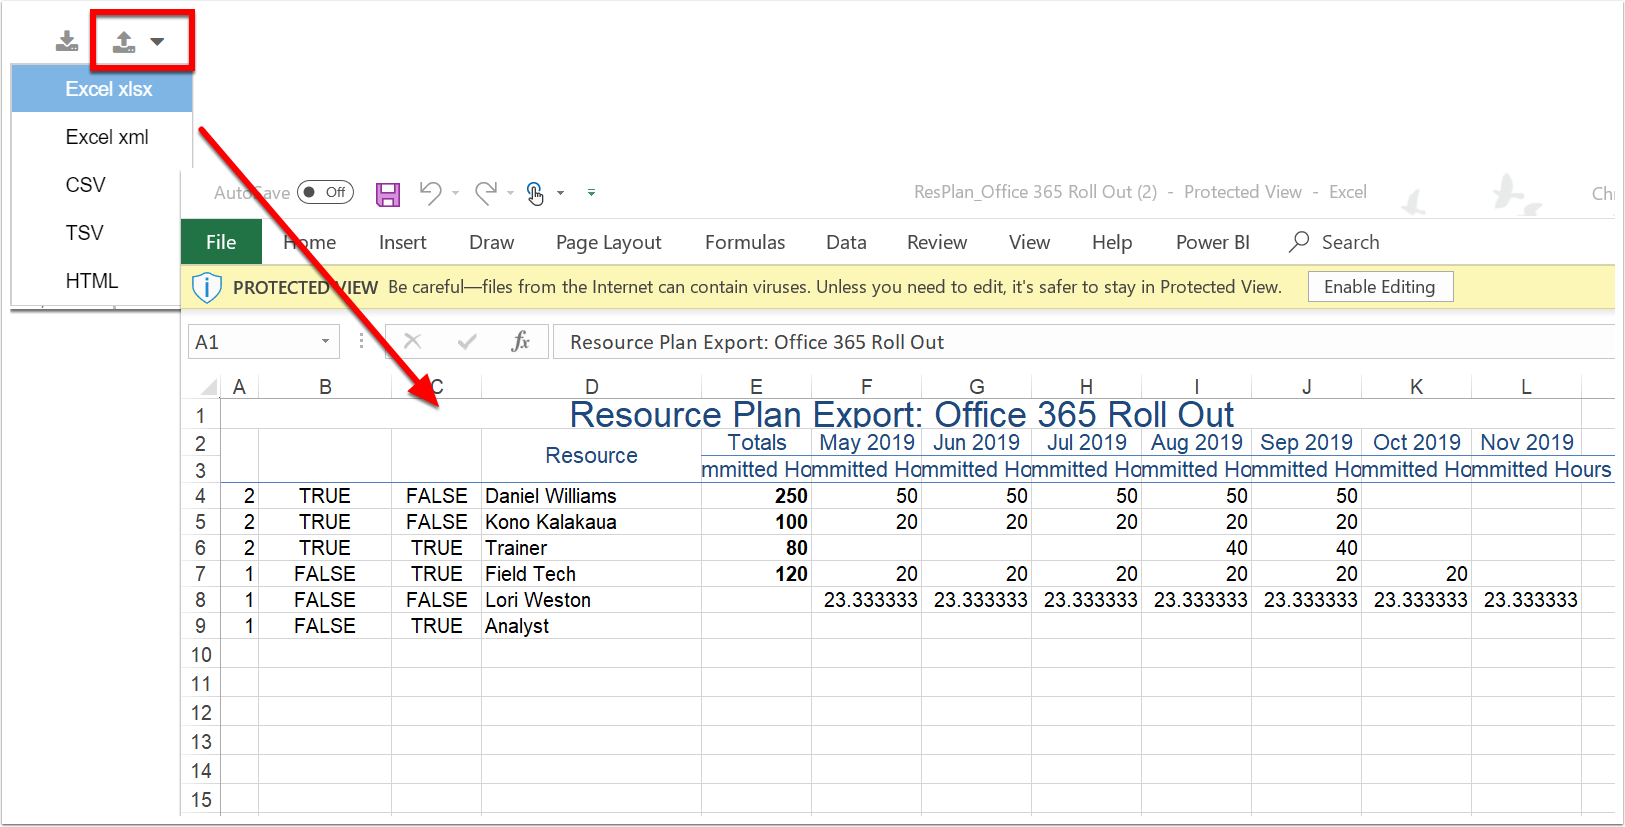
To export, first select the desired cost type, dates, and content to view. Then select your desired format from the Export menu.