Portfolio Analysis - Board, Roadmap & Dashboard
In this section:
This article explains additional Portfolios pages.
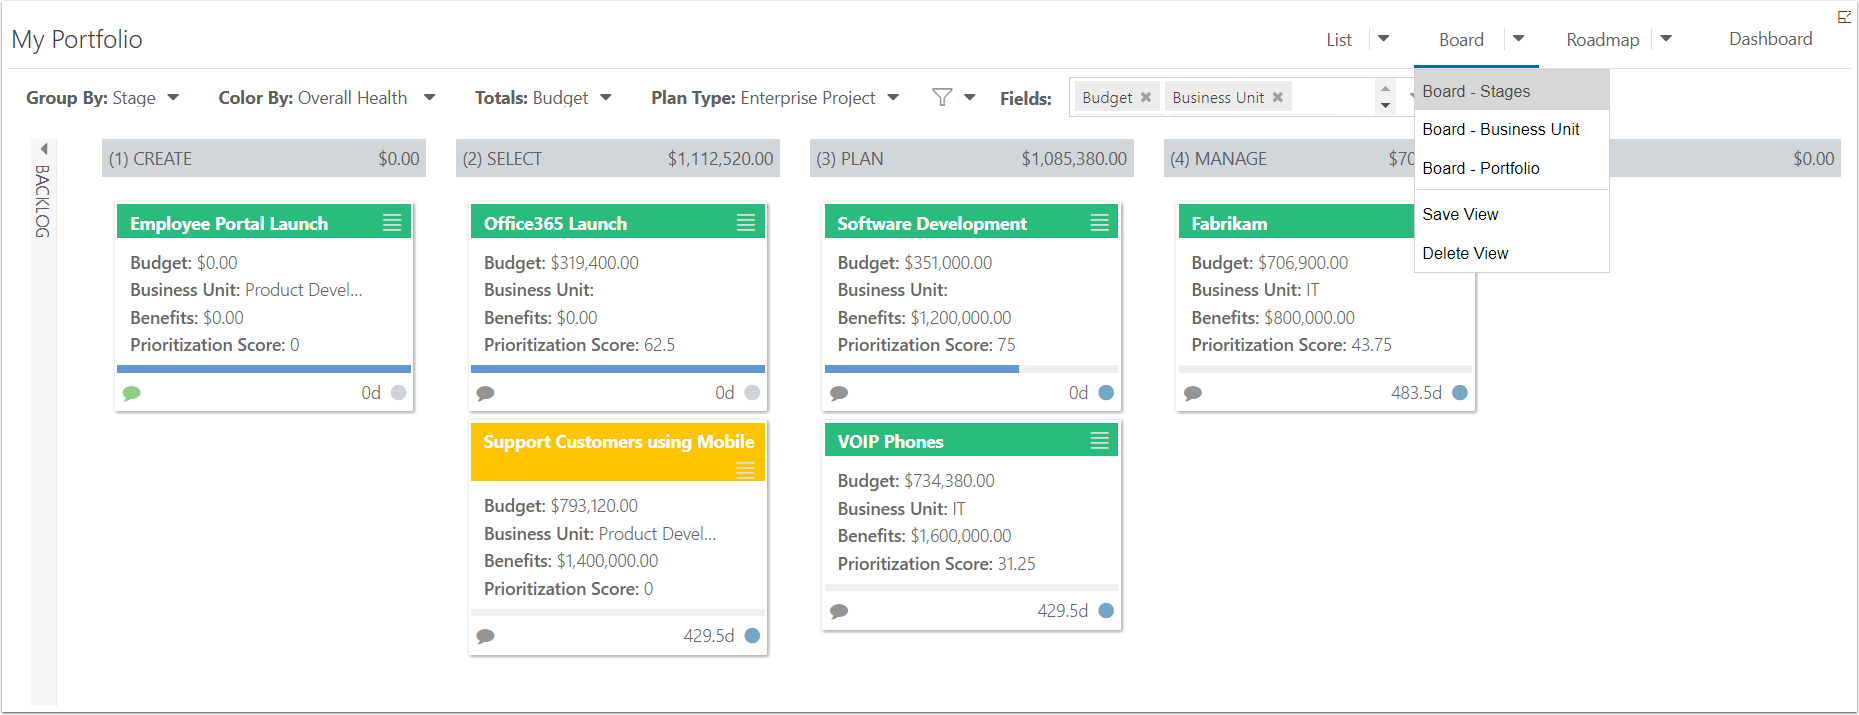
Board
The Portfolio Board page shows each plan in column swim lanes. You can change your groups and choose to include/exclude additional fields on the plan cards.
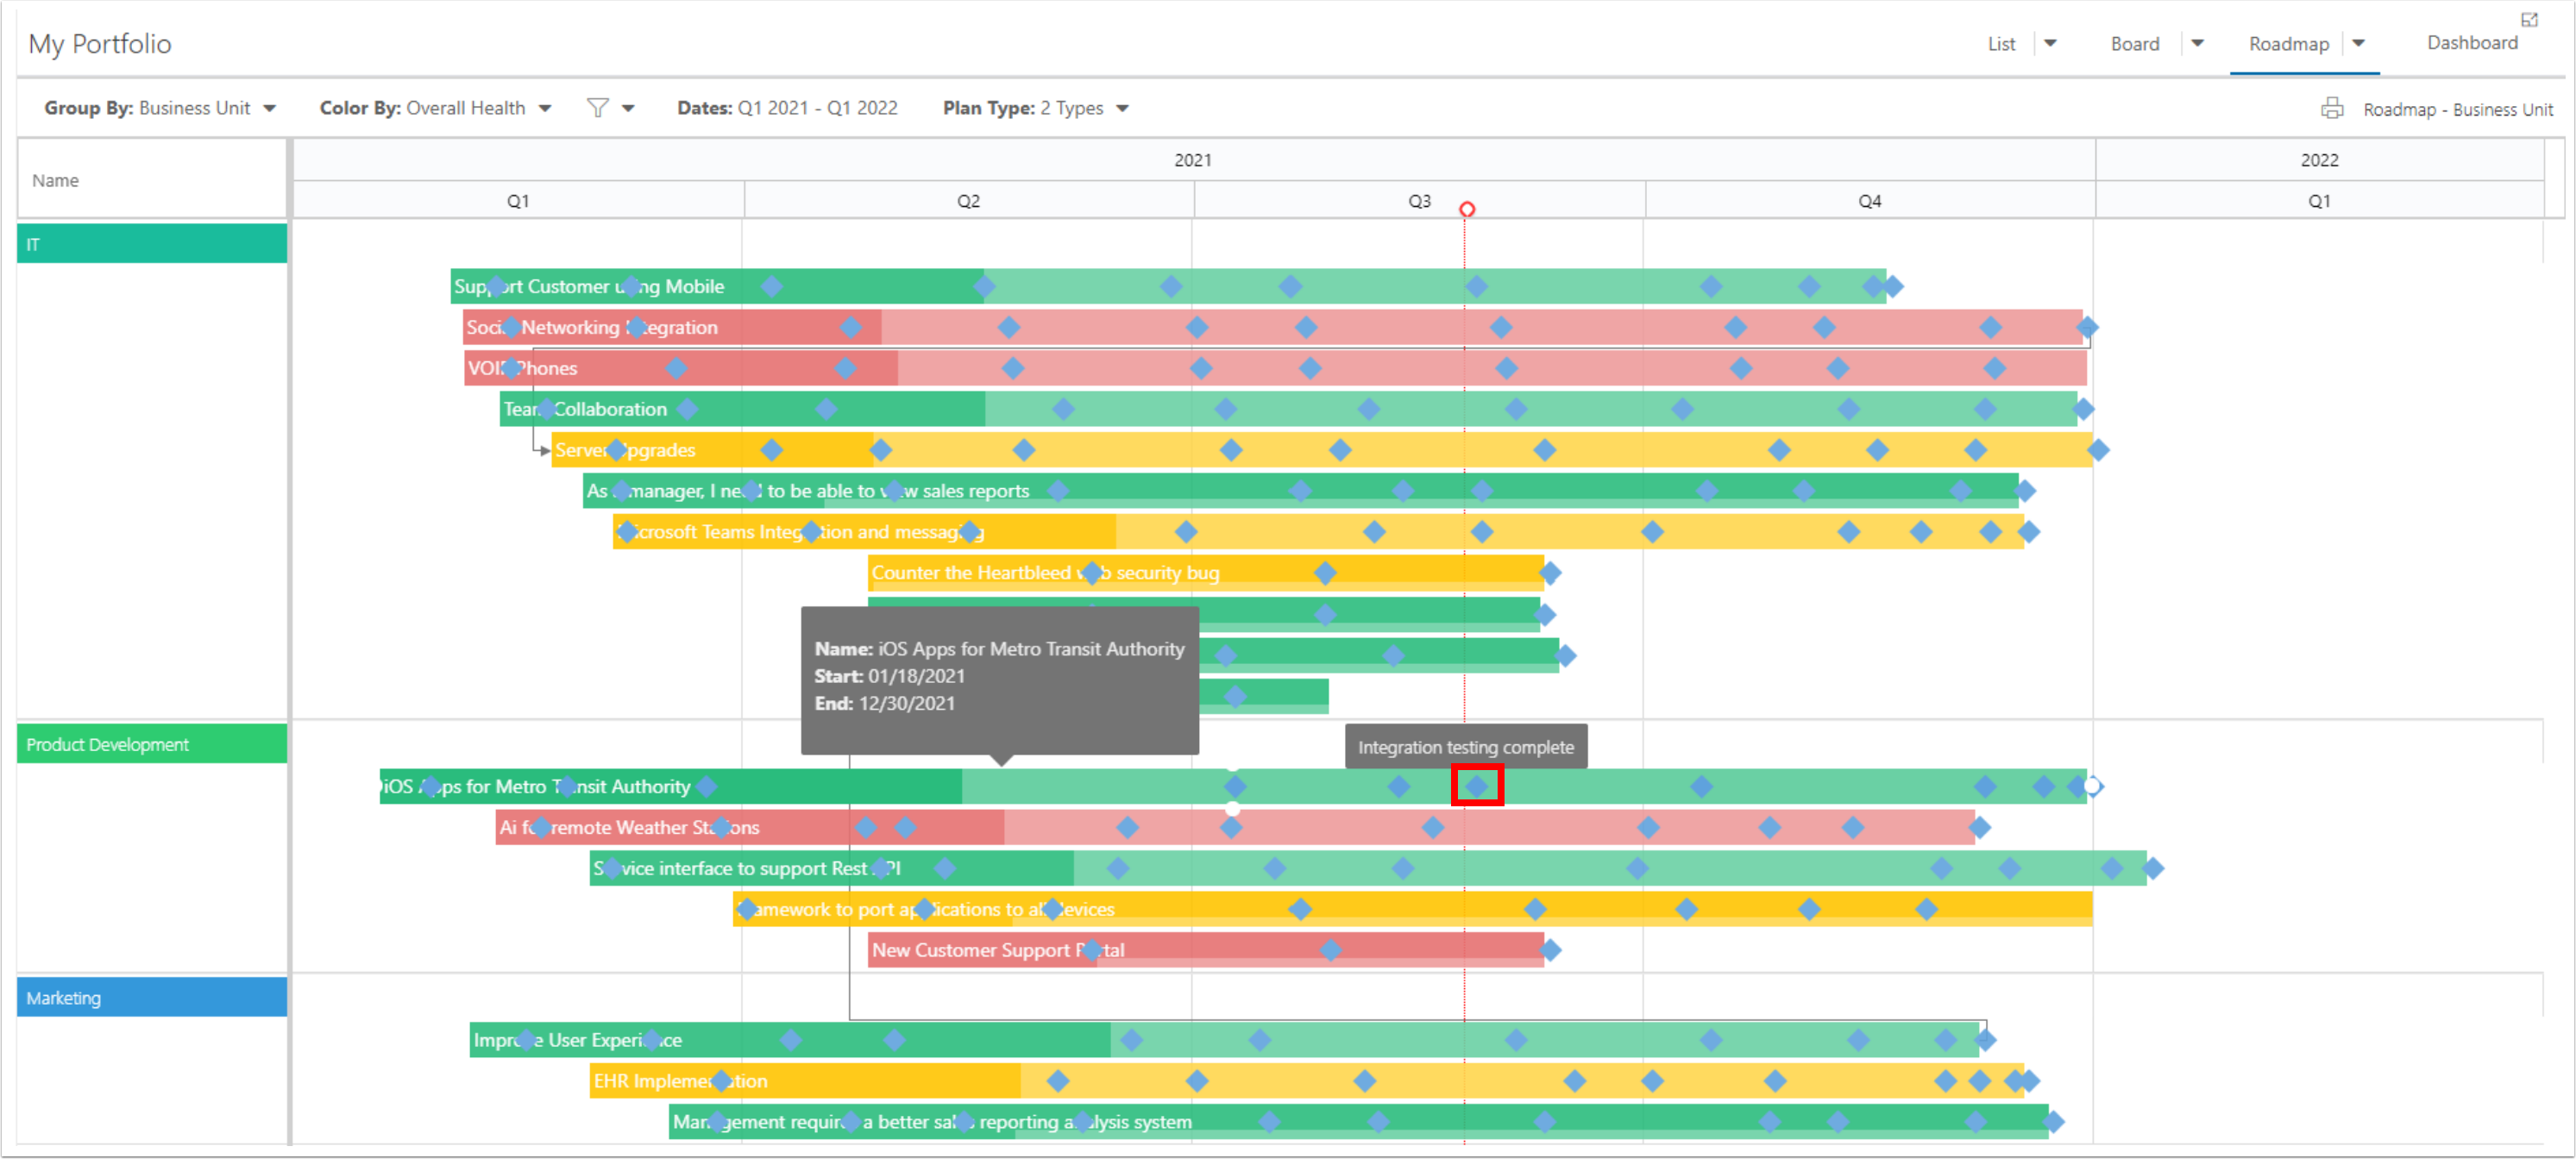
Roadmap
The Portfolio Roadmap page lists out each plan in a roadmap timeline.
Hover over the timeline bar to view a description of the plan.
Key dates are marked on the timeline bar with diamonds. These are referred to as "timeline items" which include milestones, tasks, and so on. Hover over a timeline item to view details.
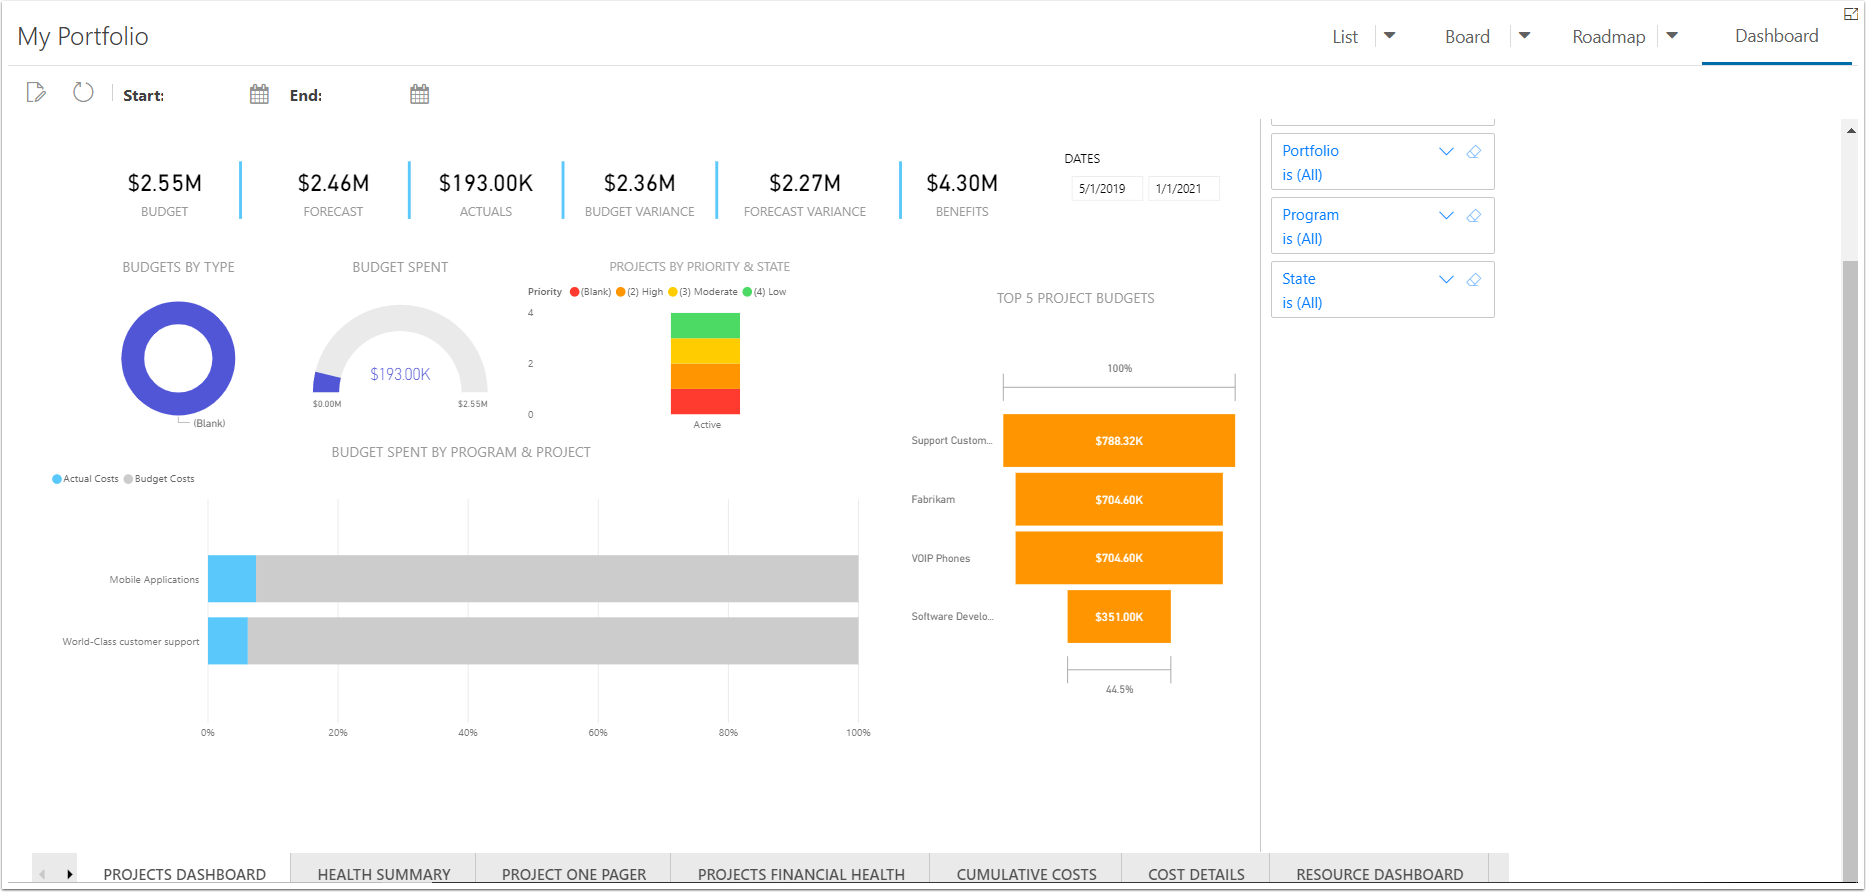
Portfolio Dashboard
The Portfolio Dashboard page can include different reports and charts. The PowerBI OnePlan Report includes tabs along the bottom with key portfolio health, financial & resource plan data.